A Stock Chart displays high, low, open, and close values for each category using vertical markers. It is used to compare value ranges and movement patterns across items such as products, locations, or time periods.
In Quixy, Stock Charts are mainly used for range comparison, not financial trading analysis.
¶ 1. How a Stock Chart Works
- Each category appears on the X-axis.
- Each bar shows the value range using high and low fields.
- Open and close fields show starting and ending values.
- This helps you quickly see spread, variation, and movement across categories.
¶ 2. How to Create a Stock Chart
After completing the initial setup for chart reports, configure the Stock chart using the following steps from the Chart Configuration page:
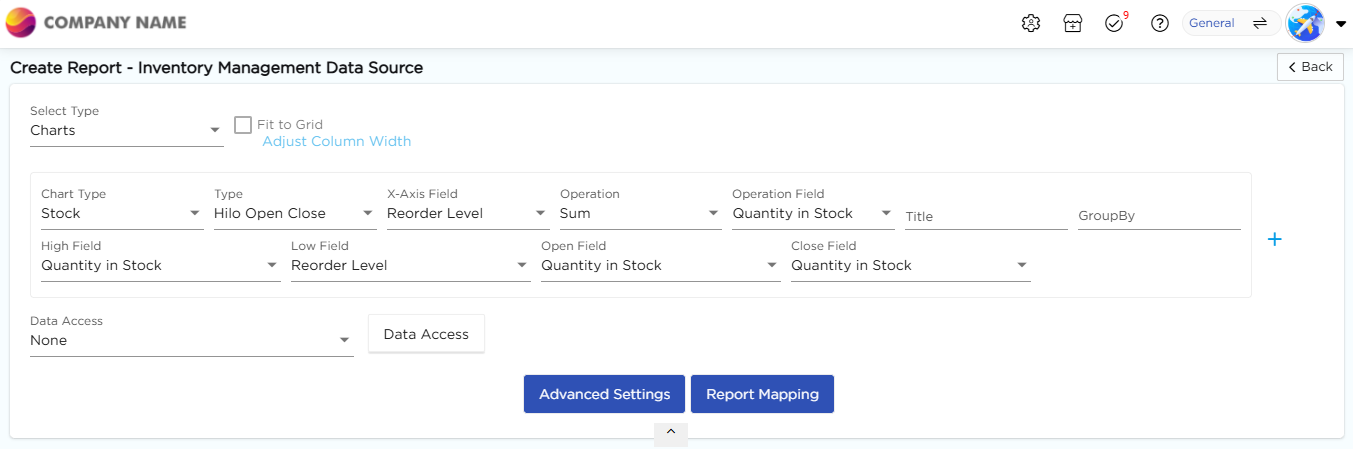
- In the Chart Type drop-down, select Stock.
- In the Type drop-down, select the sub-type for the selected chart type.
- In the X-Axis Field drop-down, select the category field.
- In the Operation drop-down, select the required operation such as Count, Sum, or Average.
- In the Operation Field drop-down, select the numeric field.
- In the High Field drop-down, select the field representing the highest value.
- In the Low Field drop-down, select the field representing the lowest value.
- In the Open Field drop-down, select the field representing the opening value.
- In the Close Field drop-down, select the field representing the closing value.
- In the Title column, enter the chart title.
- In the GroupBy column, select a field if grouping is required.
- Click Report Mapping if field mapping is required.
- Click Advanced Settings if additional configuration is required.
- Click Save to generate the Stock Chart.
Note
For details on Advanced Settings, Report Mapping, and GroupBy configuration, refer to the Chart Configuration Overview article.
¶ 3. Stock Chart Types
The following subtypes are available under Stock Chart. All subtypes follow the same configuration flow, and only the visual representation differs. Sample visuals for each Area chart subtype are shown below for reference.
| Chart Sub-Type | Image |
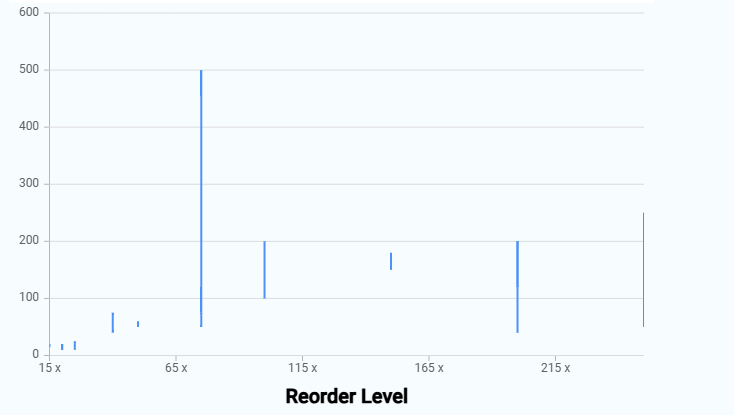
| Candle |
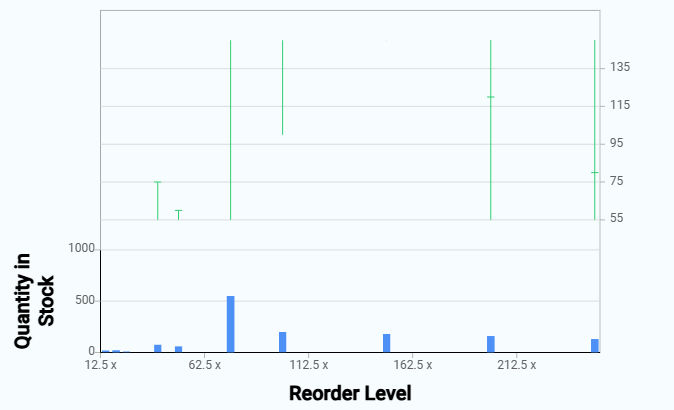 |
| Hilo |
 |
| Hilo Open Close |
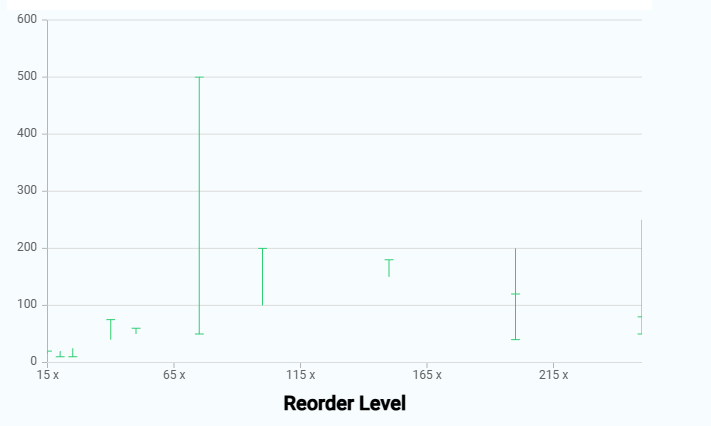 |