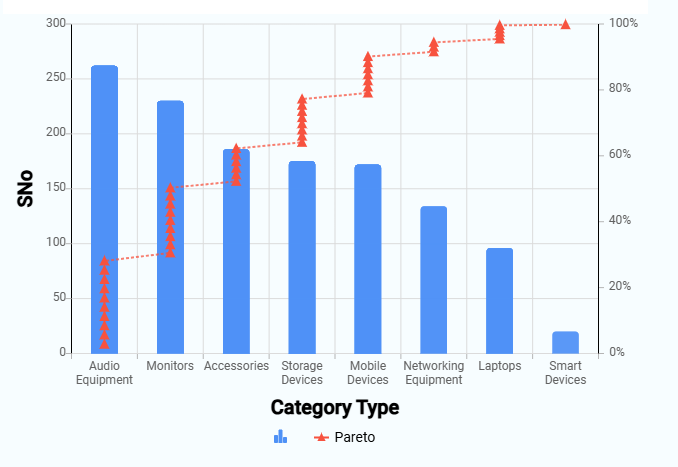
A Pareto Chart is a combined bar and line chart in which category values are displayed as bars sorted in descending order, and a cumulative total is displayed as a line over the bars. The bars show individual category contribution, while the line shows the running total across categories. This structure makes it easy to see how much each category contributes to the overall total.
¶ 1. Key elements of a Pareto
- Bars: Each bar represents a category of data. The height of the bar indicates the frequency or impact of that category.
- Line: The line graph shows the cumulative percentage of the total number of occurrences, moving from left to right.
¶ 2. How to create a Pareto
After completing the initial setup for chart reports, configure the Pareto chart using the following steps from the Chart Configuration page:
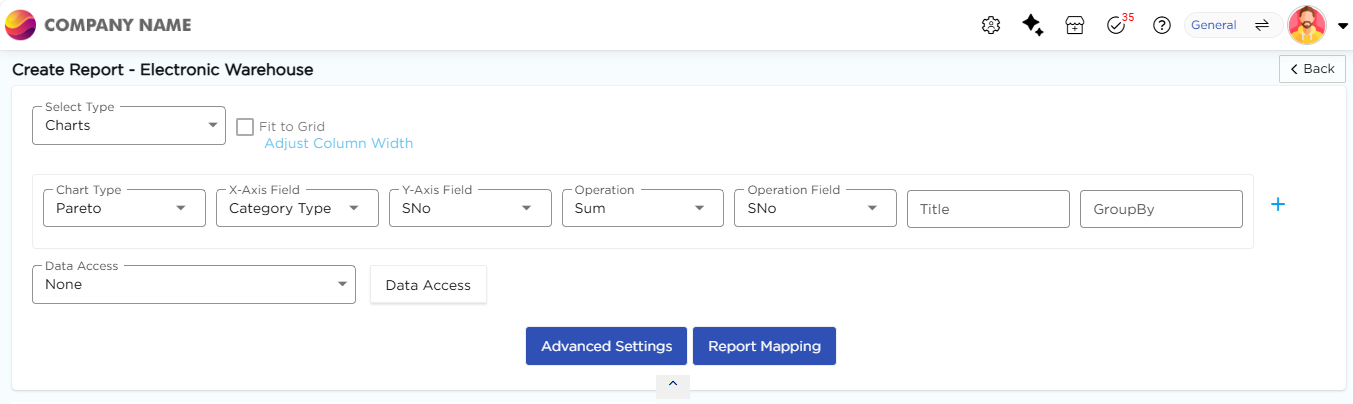
- In the Chart Type drop-down, select Histogram.
- In the X-Axis Field drop-down, select the category field.
- In the Y-Axis Field drop-down, select the numeric field.
- In the Title column, enter the chart title.
- In the GroupBy column, select a field if grouping is required.
- Click Report Mapping if field mapping is required.
- Click Advanced Settings if additional configuration is required.
- Click Save to generate the Pareto Chart.
Note
For details on Advanced Settings, Report Mapping, and GroupBy configuration, refer to the Chart Configuration Overview article.