An Area Chart displays values as a filled region under a line. It shows how a numeric value changes across categories or over a sequence, while also highlighting the magnitude of change using shaded areas. This makes it easy to see trends, growth, decline, and overall volume at a glance.
¶ 1. How an Area Chart Works
- The X-axis displays the category or sequence field.
- The Y-axis displays the numeric value.
- The area between the line and the baseline is filled to represent volume.
- Higher peaks indicate larger values. Wider areas indicate longer duration or spread.
This visual style helps compare changes over time and understand overall impact.
¶ 2. How to create an Area Chart
After completing the initial setup for chart reports, configure the Area chart using the following steps from the Chart Configuration page:
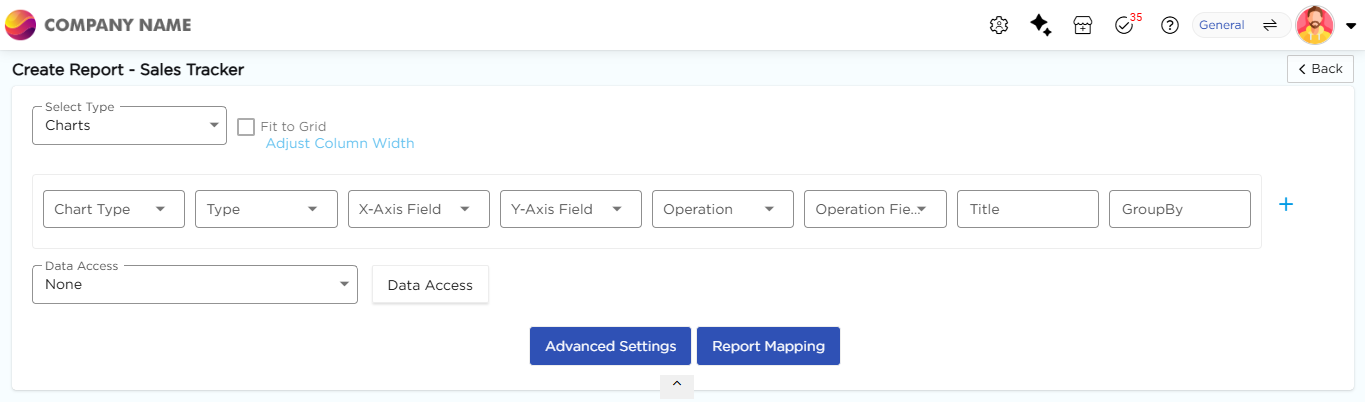
- In the Chart Type drop-down, select Area.
- In the Type drop-down, select the sub-type for the selected chart type.
- In the X-Axis Field drop-down, select the category field.
- In the Y-Axis Field drop-down, select the numeric field.
- In the Operation drop-down, select the required operation such as Count, Sum, or Average.
- In the Operation Field drop-down, select the numeric field.
- In the Title column, enter the chart title.
- In the GroupBy column, select a field if grouping is required.
- Click Report Mapping if field mapping is required.
- Click Advanced Settings if additional configuration is required.
- Click Save to generate the Area Chart.
Note
For details on Advanced Settings, Report Mapping, and GroupBy configuration, refer to the Chart Configuration Overview article.
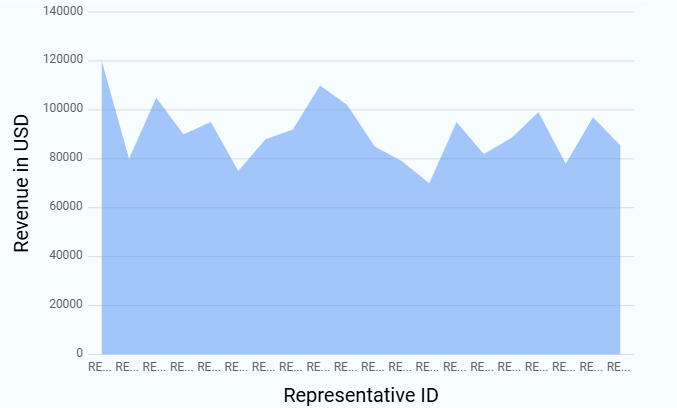
¶ 3. Area Chart Types
The following subtypes are available under Area Chart. All subtypes follow the same configuration flow, and only the visual representation differs. Sample visuals for each Area chart subtype are shown below for reference.
| Chart Sub-Type | Image |
|---|---|
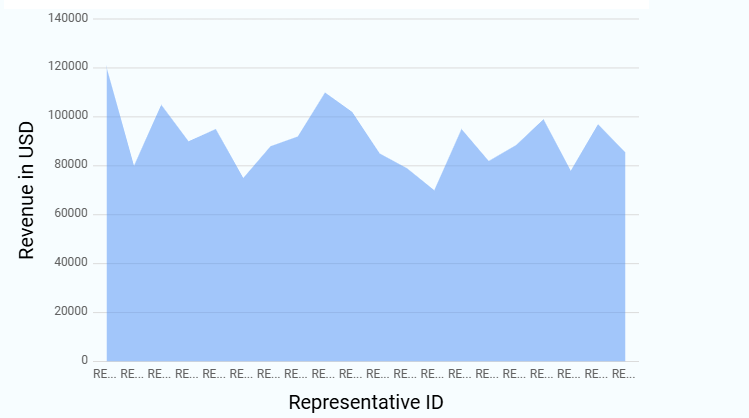
| Area |
 |
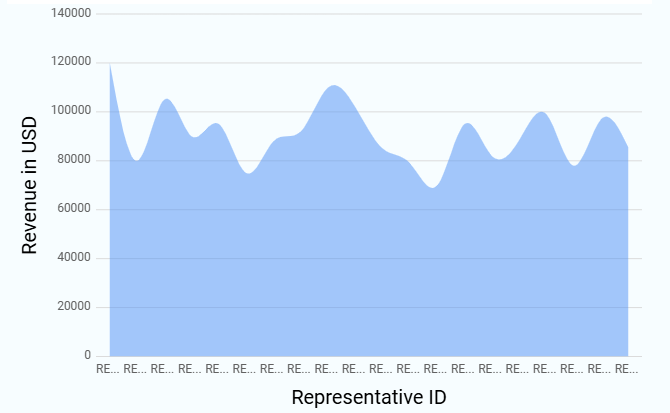
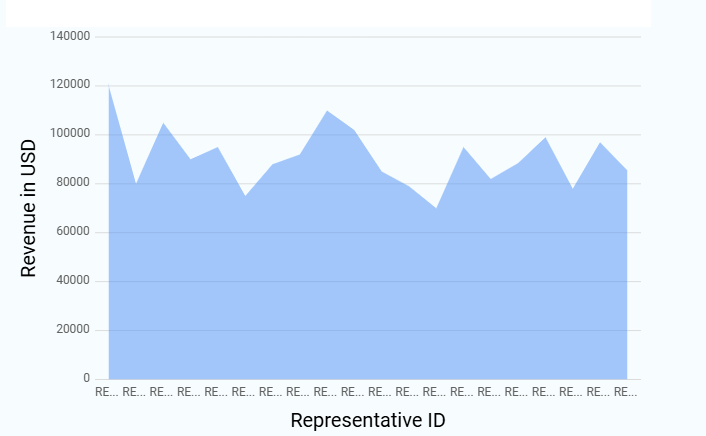
| Spline Area |
 |
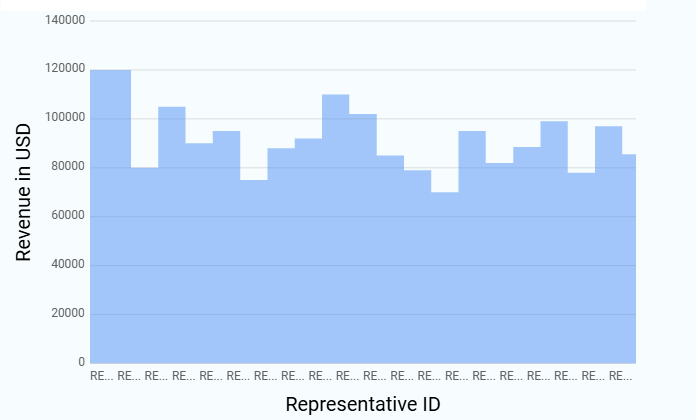
| Step Area |
 |
| Range Area |
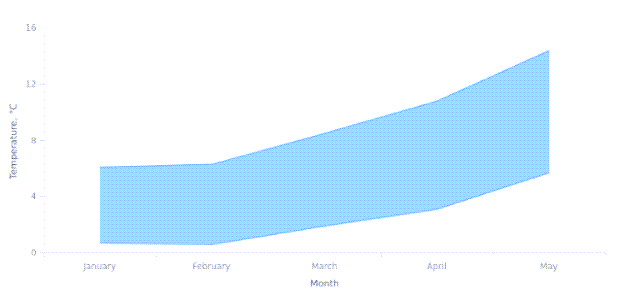 |
| Stacking Area |
 |
| 100% Stacking Area |
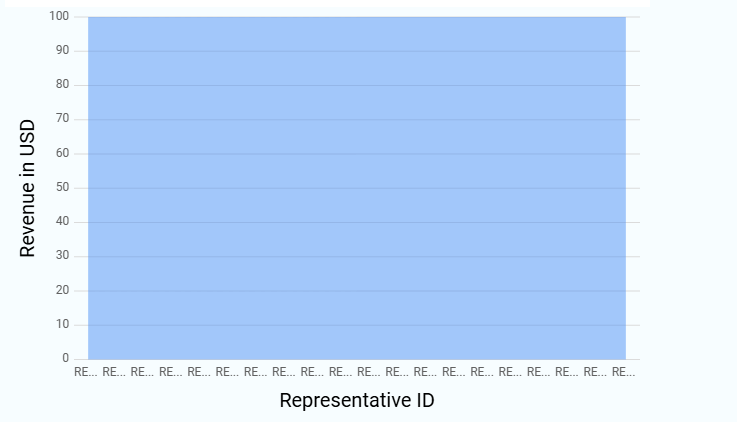 |
| Area Zone |
 |