3D charts are graphical representations of data that use three-dimensional space to display information. Unlike 2D charts, which plot data points on a flat plane, 3D charts add depth, allowing for a more immersive and detailed visualization. This added dimension can help reveal patterns and relationships that might not be as apparent in 2D representations.
¶ 1. Advantages of 3D Charts
- Enhanced Visualization: The third dimension provides a more comprehensive view of data, making it easier to identify trends, outliers, and correlations.
- Improved Insight: With the added depth, 3D charts can uncover hidden insights that are not immediately visible in 2D charts.
- Engagement: 3D charts are visually appealing and can capture the audience's attention more effectively, making presentations and reports more engaging.
¶ 2. How to create a 3D Chart in Quixy?
After completing the initial setup for chart reports, configure the 3D chart using the following steps from the Chart Configuration page:
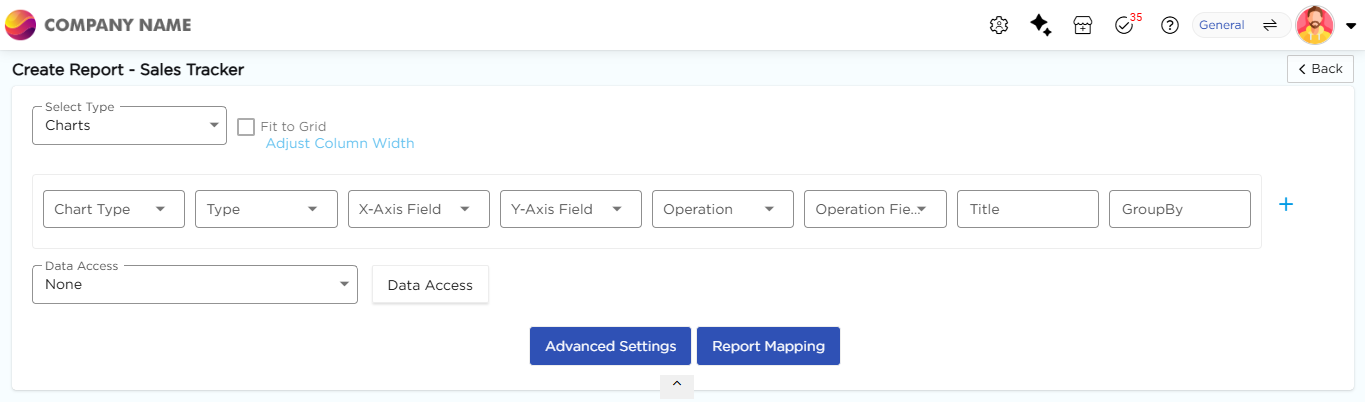
- In the Chart Type drop-down, select 3D Chart.
- In the Type drop-down, select the sub-type for the selected chart type.
- In the X-Axis Field drop-down, select the field for the horizontal axis.
- In the Y-Axis Field drop-down, select the field for the vertical axis.
- In the Operation drop-down, select the required operation such as Count, Sum, or Average.
- In the Operation Field drop-down, select the field on which the operation is applied.
- In the Title column, enter the chart title.
- In the GroupBy column, select a field if grouping is required.
- Click Report Mapping if field mapping is required.
- Click Advanced Settings if additional configuration is required.
- Click Save to generate the Bar Chart.
Note
For details on Advanced Settings, Report Mapping, and GroupBy configuration, refer to the Chart Configuration Overview article.
¶ 3. 3D Chart Types
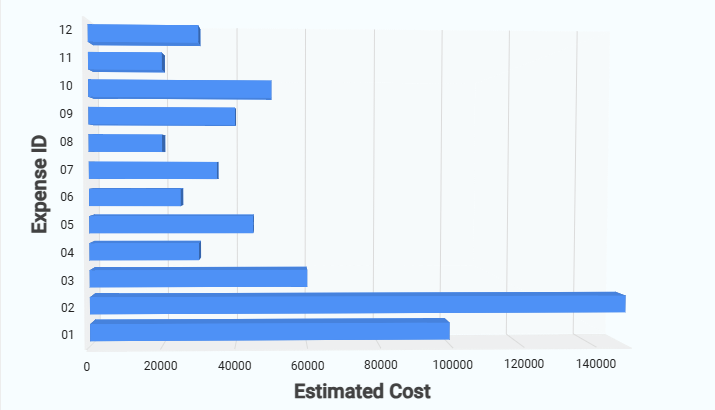
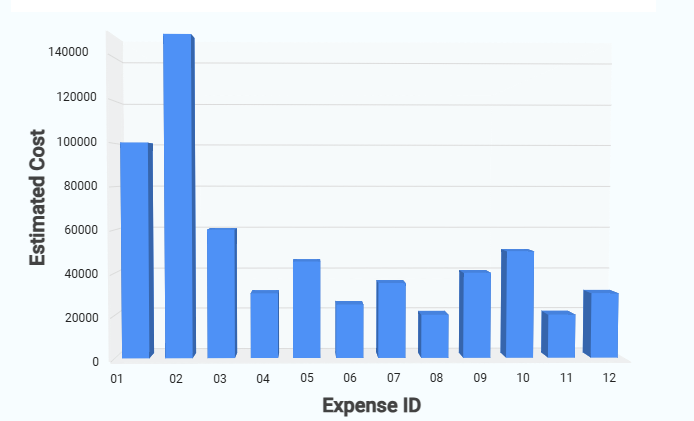
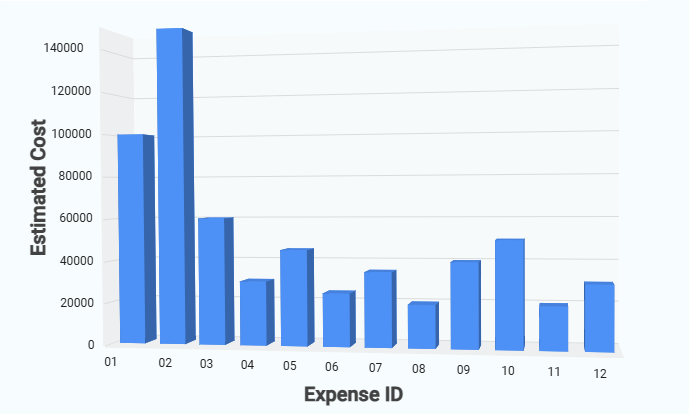
The following sub-types are available under 3D Charts. All sub-types follow the same configuration flow, and only the visual representation differs. Sample visuals for each 3D chart sub-type are shown below for reference.
| Chart Sub-Type | Image |
| 3D Bar |
 |
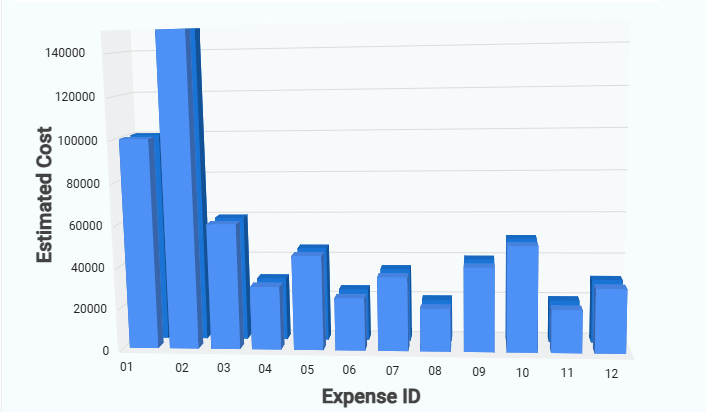
| 3D Column |
 |
| 3D Stacked Column |
 |
| 3D 100% Stacked Column |
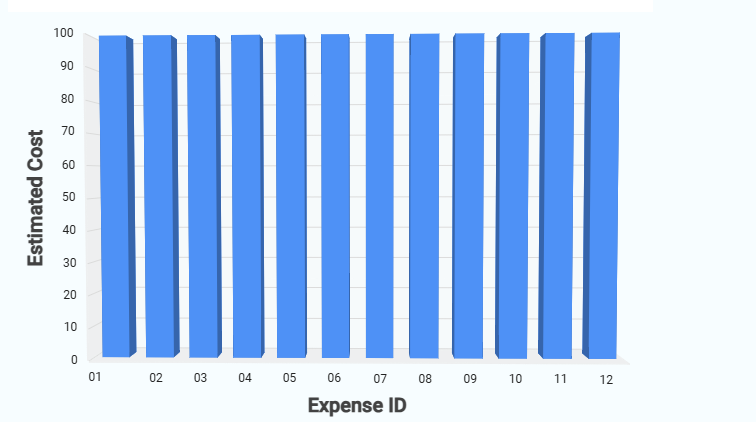 |
| 3D Back-to-Back Column |
 |