.png)
Data Source-Views (Kanban)
- 16 Minutes to read
- Contributors


Data Source-Views (Kanban)
- 16 Minutes to read
- Contributors
Article summary
Did you find this summary helpful?
Thank you for your feedback!
Kanban is a process-focused view designed to help users visualize, manage, and refine workflows efficiently. This view organizes work into columns, with each column representing a distinct stage in the process. As tasks, data points, or project elements move from one stage to the next stage, those data point or project elements are represented by cards that progress across the board, showing a clear journey from start to finish.

Understanding Data Source and Services in Kanban View
Kanban view/board depends on two key components to effectively fulfill its purpose. They are:
Data Source: The data source serves as the central repository that holds all records displayed on the Kanban board. Each record represents a card, and the data points within the card come from the field values of that record, visually organizing tasks or project elements for seamless tracking.
These cards will be moved among stages, meaning they will be transitioning from one stage to other. When this transition happens in the Kanban board, the data base (tables, sources) get updated; But, how does this work? Through a functionality called Services. But what exactly does a "Service" mean?
Services: When card moves across stages in the Kanban board, Services act as a bridge between the Kanban board and the database, ensuring smooth updates. Upon created and connected to Kanban and Data table using data function (update), here’s how it works:
Services detect the movement – When a card transitions from one stage to another on the Kanban board, Services recognize the change and trigger an update.
Data functions update the record – The corresponding record in the Data Source is updated to reflect the new stage. This, in turn, updates the Data Table (DT) since the Data Source pulls information from it.
Card details stay accurate – Since each card displays information (data points) directly from the record in the Data Table, any updates made in the table are automatically reflected on the card, ensuring it always shows the latest stage.
The Data Source stays in sync – Because the Data Source is linked to the Data Table, any updates to the table are also reflected in the Data Source.
Kanban remains aligned – Since the Kanban board is built on the Data Source, it remains synchronized, ensuring that cards stay in their correct stages without discrepancies.
This flow ensures real-time updates and consistency across the Kanban board, Data Table, and Data Source, keeping everything seamlessly connected.
Now that we have a clear understanding of the key foundations and the functional flow of Kanban, let's explore how to create one.
IMPORTANT
To simplify understanding the process of creating a Kanban view, let's break it down into three main parts, each focusing on a specific aspect. This will make it easier to understand and implement a fully functional Kanban.
Initiating creation of a Kanban: This phase involves setting up the foundational elements (Table, Source, Service) of your Kanban board.
Configuring a Kanban: Initiating the creation of a Kanban is just the beginning; next, you need to organize the board. This involves determining how the columns/stages will be structured and integrating the board with the service.
Personalizing a Kanban: Personalizing a Kanban is the final and most crucial step to make it truly effective and tailored to your needs. This involves customizing the appearance by adding colors to columns or data points, making it easier to identify task priorities and their importance at a glance. You can enhance cards by incorporating images, unique colors, adjust cards width and flexible layouts that provide additional context and align with your processes needs. Filters and specific settings can also be applied to streamline your view and focus only on what matters most.
Initiating creation of a Kanban
To create a fully functional Kanban, few prerequisites must be met and shall be created, before the creation of Kanban.
Let’s go through these requirements with a use case
Use Case - Customer Support Tickets
Let’s consider a Customer Support Ticket use case, where the Kanban view is used to track tickets. In this case, the tickets are divided into different stages, like Open, In Progress, Resolved, Hold, and Closed, which represent the progression of the support tickets.
Pre-requisite 1: Create Data Tables
Start by creating tables that holds customer issue details, either by importing an Excel file or building it from scratch.
Based on the use case, include the following columns in table 1:
Ticket ID: Unique identifier for each ticket.
Description: Description of the issue.
Issue Type: Type of the issue (e.g., bug, feedback, feature request).
Due By: Due date of the ticket.
Requester: Name of the requester who submitted the ticket.
Status: Current status (Open, In Progress, Resolved, etc.)
Include the following columns in table 2:
Status: Current status (Open, In Progress, Resolved, etc.)
Color: Hex code define the colors of the Kanban column headers.
Set Ticket ID as the primary key in table 1 and Status as the primary key in table 2, and click Save.
After saving the tables, CRUD functions will be created, which are helped to establish a connection between the tables and service.
Pre-requisite 2: Create a Data Source
The data source serves as the foundation for your Kanban view.
Navigate to Admin Menu → Database → Data Source.
Click on "Create a Data Source".
From the available options, select "Basic".
A pop-up will appear, prompting you to choose data tables. Select Table 1 and Table 2.
Select the required elements from Table 1 and Table 2.
Use Left Joins to establish a connection between Table 1 and Table 2.
Assign a unique name to the data source and click Save.
Pre-requisite 3: Create a Service
Services are essential for ensuring that any updates made on the Kanban board are reflected and saved in the data table.
Navigate to Admin Menu → Apps → Create a Service.
Create a service and add the necessary elements, linking them to the corresponding elements (using update function) of the data table created earlier. Learn more about services and how to create one…
Pre-requisite 4: Add-ons
An add-on acts as a plugin that extends the functionality of a View by providing additional columns, actions and rules to define behaviour of actions and columns. Later in this article, you will learn how Add-ons can benefit a Kanban View. Know and learn more about Add-ons and how to create it….
Create a smart column named "Priority" and assign it a default static value of "Low." While smart columns typically hold constant values, you can modify their data dynamically using rules.
Now, define a rule based on the Issue Type:
If the Issue Type is Bug, set the Priority to High.
If the Issue Type is Feedback, set the Priority to Medium.
If the Issue Type is Feature Request, keep the Priority as Low.
This approach ensures that the Priority value adapts automatically based on the type of issue while maintaining the flexibility of smart columns.
Configuring a Kanban
A Kanban view can be created using two methods:
Method 1:
Go to Admin Menu → Reports → Create View.
Choose the data source you created earlier for the view.
After selecting the source, provide a name for the view.
Select an existing add-on from the dropdown, or create a new one by clicking on "+ Create an Add-on."
After selecting the Add-on, choose the Kanban View sub-type and click "Next."
Method 2:
Go to Admin Menu → Database → Data Source.
Select the desired Data Source for your view and click on it.
An Actions panel appears to the right with a list of actions; select "+ View" to start the view creation process.
Give the view a unique name and display name.
Choose an existing Add-on from the dropdown or create a new one by clicking "+ Create Add-on."
Under View Type, select Kanban and click "Next."
Once the Kanban board is created, the next step is configuring it.
This involves structuring the and reordering the columns in the board, as well as integrating service to the view and mapping the elements of service to Kanban view. By linking the service, any updates made on the Kanban board will be reflected in the data tables through the service’s functions.
The configuration process begins on a dedicated page with three main customization options:
Organize Board By: Select a column from the data source to organize the Kanban board. The board will be arranged according to the values in the chosen column, essentially defining the progression of a process from beginning to end. For this use case, we will choose the "Status" column, as its values will determine how the board is structured.

Choose Color Column: Assign distinct colors to the values in the Status column. The Color Column should be predefined in the Data Table, ensuring it is available in the Data Source. When configuring the Kanban board, simply select this Color Column from the dropdown. The assigned colors will automatically apply to the corresponding Status values, visually distinguishing each stage.
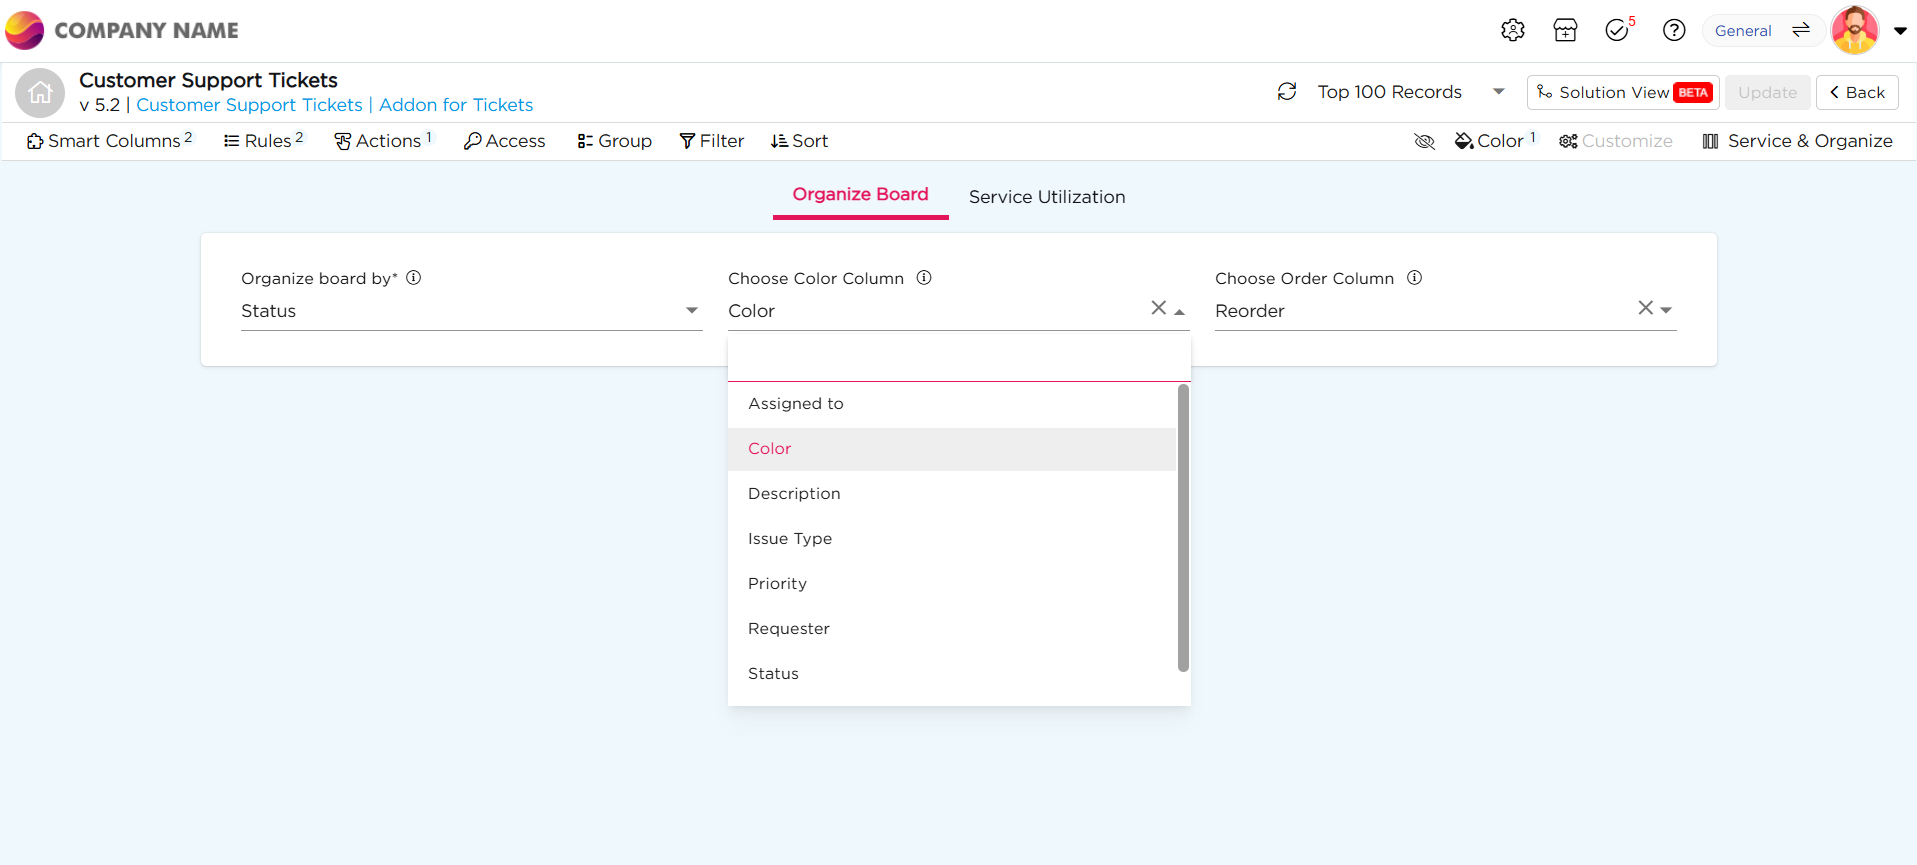
Choose Order Column: By default, the columns in the Kanban board are derived from the selected Data Source column (e.g., Status). However, these values are arranged alphabetically, which may not reflect the actual workflow sequence.
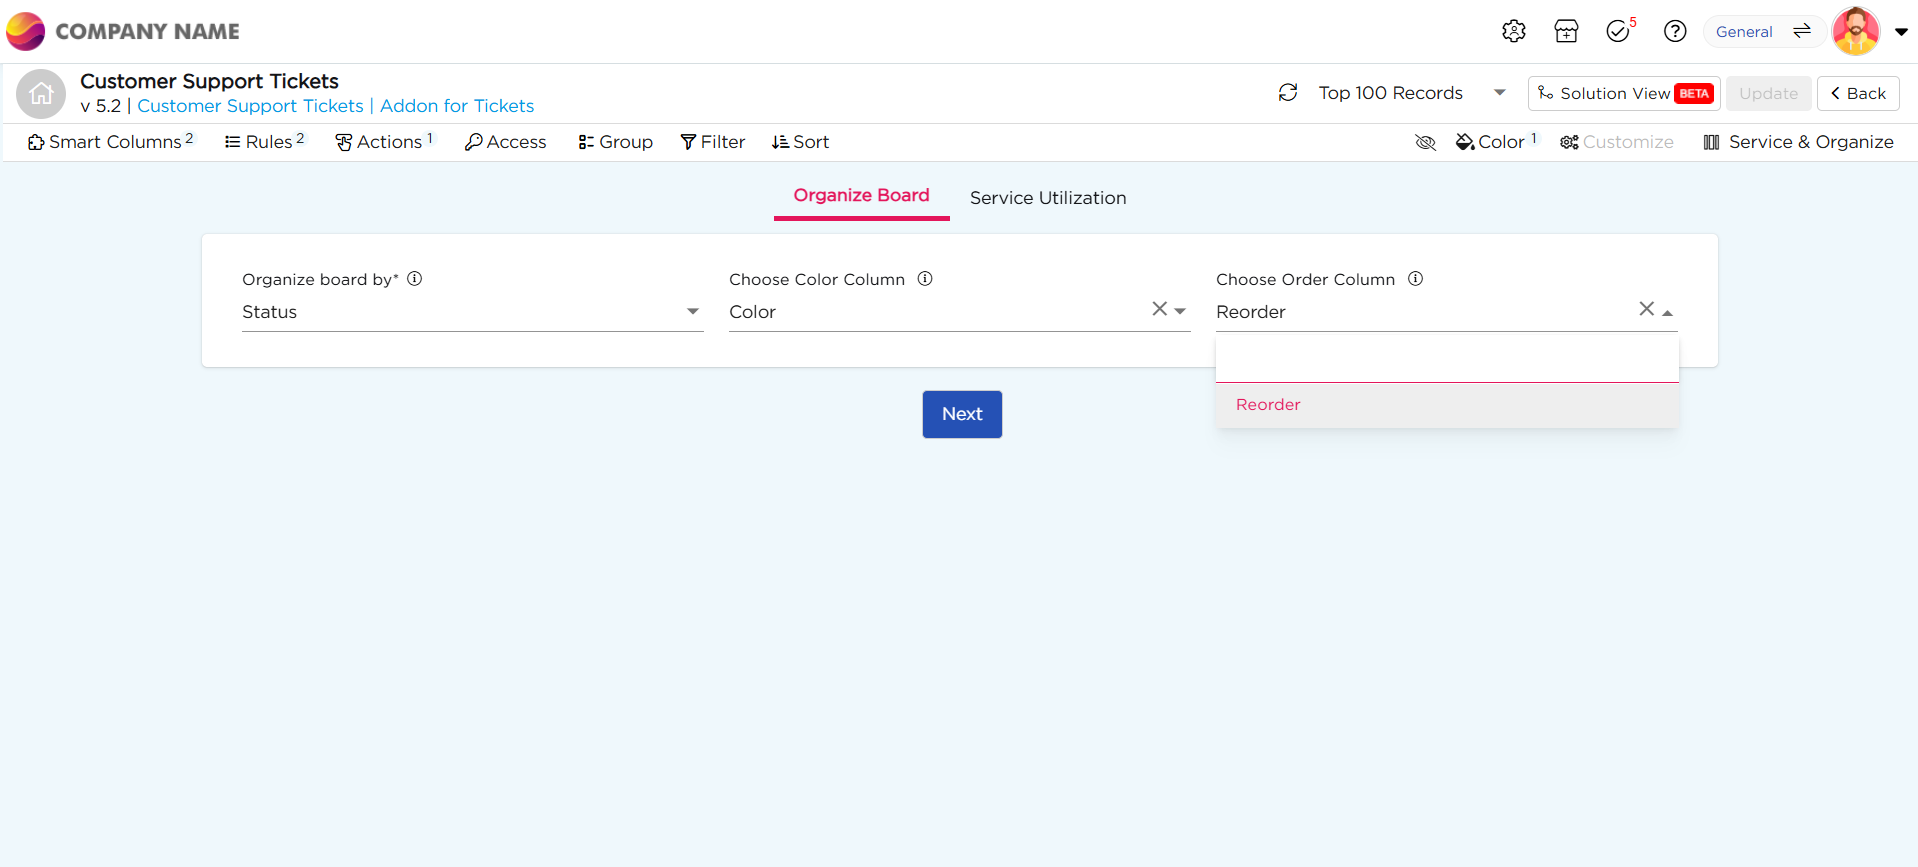
To ensure the board follows a logical progression, you can create a custom Order Column using add-ons. This allows you to define the exact sequence of stages so that the Kanban board aligns with your process flow.
For instance, in a customer support workflow, stages may include:
Open → In Progress → Testing → Resolved → Closed
By default, a Kanban board might alphabetically arrange them as:
Closed → Hold → In Progress → Open → Resolved
Since this order doesn't align with the natural support process, a custom Order Column ensures the process is correctly structured, keeping your board organized and efficient.


To alter this default flow, follow the process below
How to adjust the alphabetical order to match your process flow?
Start to create an add-on.
Click + Addon, on the title bar, located just below the title of your view.
A pop-up appears, saying "Select Add-on", click on "+ Create Add-on."
Upon clicking on it, it will redirect you to the add-on creation page.
Here, you can create smart column, rules, and action. Know more about these smart column, rules, and action……
Step 1: Create a Smart Column in an Add-on
Access Smart Columns: In the Add-On creation page, click on Smart Columns in the top menu.
Add a Smart Column: Click on + Add Smart Column to create a new smart column.
Set Column Details:
Column Name: Name the column as Order.
Element Type: Select Number for the element type.
Save: Save the column without assigning any value to it at this stage.
Step 2: Write Rules for Custom Ordering
Define Ordering Rules: To determine the custom order of columns in your Kanban view, you need to write rules that specify how the columns will be arranged based on the values in the Order column.
Example Rule: If the stages in your process are "Open" and "In Progress", the rules would be as follows:
Assign a value of 1 to "Open" to ensure it appears first.
Assign a value of 2 to "In Progress" to place it second.
Use If-Else Logic: If the value is "Open", set the Order value to 1. Else If the value is "In Progress", set the Order value to 2.
Apply the same logic to each stage in the process, assigning values to define the order. By setting these rules, you control the sequence in which the columns appear on the Kanban board, ensuring they align with the workflow you’ve defined.


Once you've structured the board, assigned colors to the Kanban column headers, and arranged the columns in the desired order, the next step is to integrate a service into the Kanban and map the Kanban elements to the service.
Service Utilization: This is where you integrate a service with a Kanban, ensuring that any changes made within the Kanban are reflected in the data source.
Select the Service: To begin, select the service you created earlier and assign it to the Kanban view. This ensures that the Kanban is connected to the appropriate service, allowing it to interact with the data and trigger necessary actions.
Specify the Trigger Event: Events are essentially the data functions you created when setting up the service. These functions handle actions like updating data in the table. For example, you should choose an update function as the event, so whenever a change is made in the Kanban board (e.g., moving a task to a different column), the service will instruct the table to update the status of the corresponding row. This ensures the data remains synchronized.
Mapping: Mapping refers to the process of connecting the elements of your Kanban view with the corresponding elements in the service. Here's how it works:
Map Kanban Elements to Service: Each element (e.g., task status, columns) in the Kanban view needs to be linked to a corresponding element in the service. This mapping ensures that when a user interacts with the Kanban (e.g., moving a task between columns), the change is communicated to the service.
Synchronization: The mapped service elements act as intermediaries between the Kanban and the data table. When a task’s status is updated in the Kanban, the service informs the data table to update the status for that specific row, maintaining data consistency
Actions: Under Actions, you can enable, disable, or delete the service based on your preferences. This step allows you to control the functionality and behavior of the service as it interacts with the Kanban view.
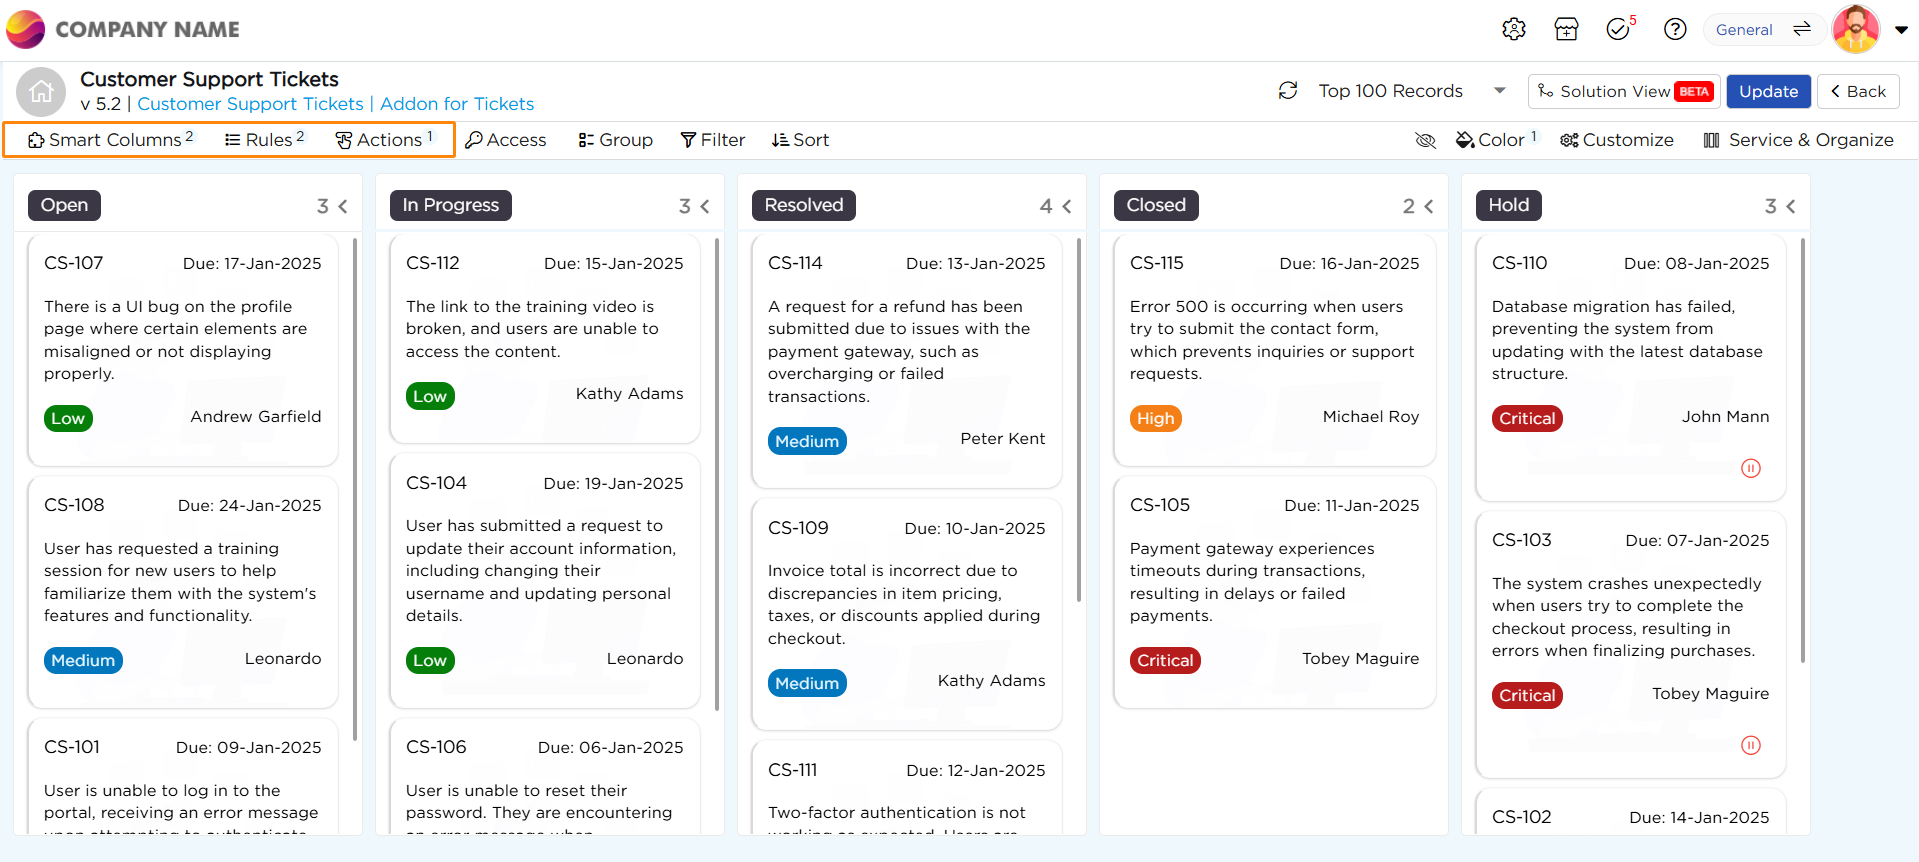
Navigating the Kanban View
Once the Kanban View is set up, you can utilize smart columns, rules, and actions. These are available when an Add-on is integrated.
Smart Columns: Smart columns or Static columns which are created in the add-on will appear here for you reference.
Rules: The Rules which are defined or created in the Add-on will appear here for you reference.
Actions: Actions which are configured and defined in the add-on will appear here for you reference.

NOTE
You can make edits to the data source from the Add-On creation page by clicking the hyperlink under the Add-On name. Reload the page after editing to see the updates.
Access Control: Define access levels for users.
Manage Roles
Think of it like setting up teams for your workspace—quick and effortless!
Start by selecting a workspace from the dropdown menu.
Next, use the roles dropdown to choose the roles you want to assign.
Want to set up more workspaces? Click Add Access to include another workspace and assign roles there.
When you're ready, click Next to continue.
Columns & Filter Access
Think of the columns as sections in your notebook. You decide who can look at them or make changes.
Hide: If you want to keep a column secret, just hide it. No one else will see it.
Enable: Want others to see and update it? Enable the column for them.
Disable: Let them see the column but not make any changes.
Now, let’s talk about the rows in your table. You can control how much data people can work with:
Restrict: Give them access to only certain rows.
Allow: Let them see all the rows without restrictions.
Data Access
Control what users can access based on specific details about them. For example:
Logged in User Company Name: Allow access only to data tied to the user’s company name.
Logged in User Email: Restrict or grant access based on their email address.
Logged in User Employee Code: Use employee codes to specify what information someone can view or edit.
None: No restrictions are applied; users can access all data.
Finally, click Save to apply the settings.
This approach ensures that each person has appropriate access to the data they need, making role and access management seamless and secure.
Group: Set grouping preferences for data organization.
Filter: Add filters for more precise data views.
Sort: Control the order of data within columns.
Hide Columns: Choose columns to hide for a cleaner layout.
Color Rules: Color rules are used to apply colors to data based on defined rules. These rules are similar to business rules but focus on visualizing data through colors. The colors dynamically reflect the state or category of the data, helping users easily interpret or identify important information at a glance. You can setup colors field level and row level colors.
Customize Settings: These are the setting to personalize and customize the Kanban View.
Column Wise Count: Displays the count of items or tasks in each column on the Kanban board.
Toggle Column: Enables or disables the visibility of specific columns in the Kanban view.
Incremental Flow: Allows tasks or items to move sequentially through the workflow stages in predefined steps.
Choose Global Search Fields: Select fields that will be searchable across the Kanban board or the application.
Customize Cards: The Customize Cards feature allows you to modify the appearance and content of Kanban cards to suit your specific needs. It offers a combination of predefined layouts and a custom layout option, as well as tools to adjust the design and style of the cards.
Card Customization options
Here's how you can customize the Card Layout for List View to enhance the mobile experience:
Choose Card Layout: From the dropdown, select one of the following card layouts:
Layout 1 (6 Fields)
Layout 2 (6 Fields)
Layout 3 (5 Fields)
Custom Layout (up to 20 Fields)
Layouts 1, 2, and 3 come with a fixed structure, where you can add or remove fields, but you can't change the order or size of the fields. If you delete a column, simply replace it with another, keeping the original structure intact.
If you need more flexibility, select Custom Layout, which lets you add up to 20 fields. You can arrange and resize the columns to suit your needs.
Default Pagination: Define the number of records to display per page.
Once you've selected the layout, click Update Fields button to open the customization panel and start making adjustments.
.jpg)
The customization panel allows to adjust the appearance and behavior of the card layout:
Field-Level Customization:

For Labels:
Font Size: Choose from small, medium, or large.
Text Wrap: Turn on this option to make the label text wrap within the container, ensuring it's fully visible.
Font Style: Pick from bold, italic, or underline for a distinct look.
Horizontal Alignment: Align the label text to the left, center, or right.
Text Color: Pick a color to make the label stand out.
Show Label Toggle: Turn this on or off to display or hide the label in your list view.
For Data:
Font Size: Choose the size of the text (small, medium, or large).
Text Wrap: Enable text wrapping for the data to stay visible within its box.
Font Style: Choose from bold, italic, or underline.
Horizontal Alignment: Align the data text to the left, center, or right.
Text Color: Pick a color for the data for better visibility.
The UI of the entire card layout can also be customized by selecting the UI Preferences icon in the customization panel.
.jpg)
UI Preferences: The UI preferences provide customization settings for Label and Data for the entire card layout. The properties include:
Font Size: Choose from small, medium, or large font sizes.
Text Wrap: Enables text to wrap within the container to stay visible.
Font Style: Choose font styles between bold, italic, or underline for labels and data.
Horizontal Alignment: Align text to the left, center, or right.
Text Color: Adjust the text color for both labels and data.
Background Color: Select a background color for the card layout.

Background Image: Add an image as the background for the card layout.
.jpg)
Show Label Toggle: Turn this on or off to show or hide column names in the list view.
.jpg)
.jpg)
Preview Toggle: Toggle on to preview how the Card Layout looks on a mobile device.
The following two options allow you to customize the List Layout within the List View on the mobile app::
Choose Fields: Choose up to a maximum of 3 fields to display in the mobile list view.
Adjust Column Width: Adjust the width as per preferences.
Select Fields to Display in Cards: Choose specific fields to show on each card for quick reference.
Tool Tip Template: Define the format and information shown in the tooltip when hovering over a card. By enabling this feature, you can select fields to display their associated data. When users hover over a card, a tooltip will appear, providing a concise summary of the selected information.
Expand Card on Click: Opens a detailed view of the card when clicked for more comprehensive information.
Was this article helpful?