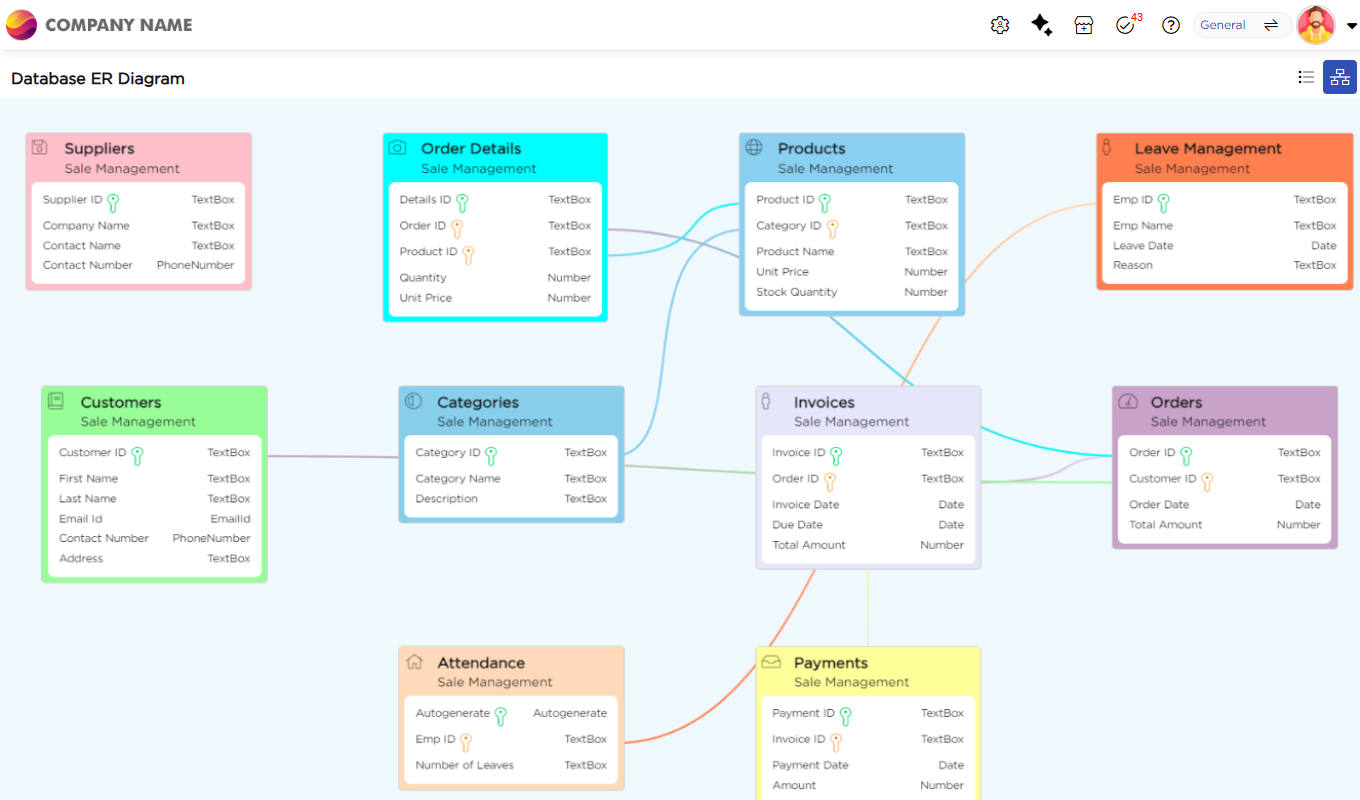
The ER View in Quixy provides a visual representation of all data tables within a workspace, along with their columns and the relationships between them. It helps users understand how tables are structured and interconnected, making it easier to design, manage, and troubleshoot data models.
¶ 1. What the ER View Shows
In the ER View, users can see data tables displayed as entities with their columns, primary keys, and foreign key relationships. This visual layout provides a clear understanding of how tables are connected without opening each table individually.
¶ 2. Why ER View Is Useful
The ER View helps users quickly understand data structure and relationships across a workspace. It simplifies tasks such as reviewing table dependencies, validating relationships, and planning changes to the data model.
¶ 3. Who Can Use ER View
Admins, including Data Admins, Organization Admins, and Workspace Admins, can view tables and analyze table relationships directly in the ER Diagram view.
¶ 4. How to Navigate to ER View
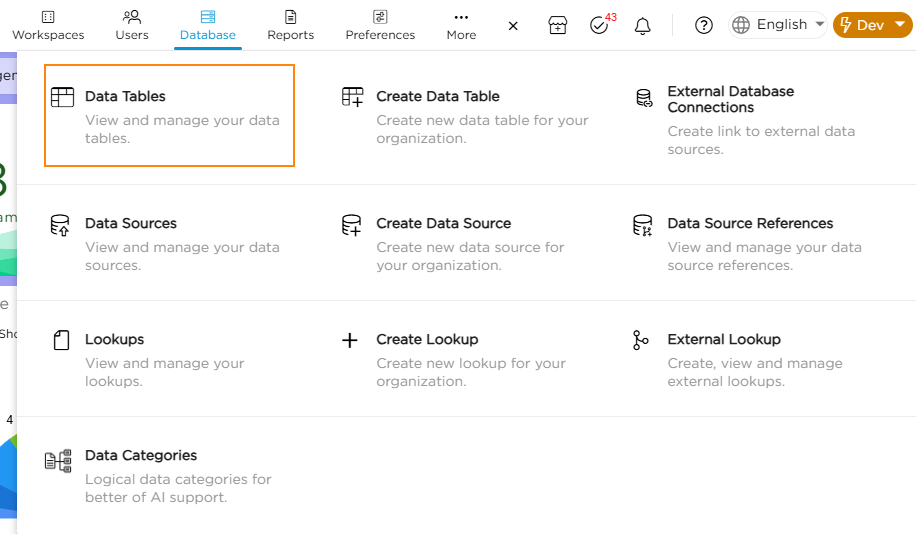
1. Navigate to Admin Menu → Database → Data Tables.
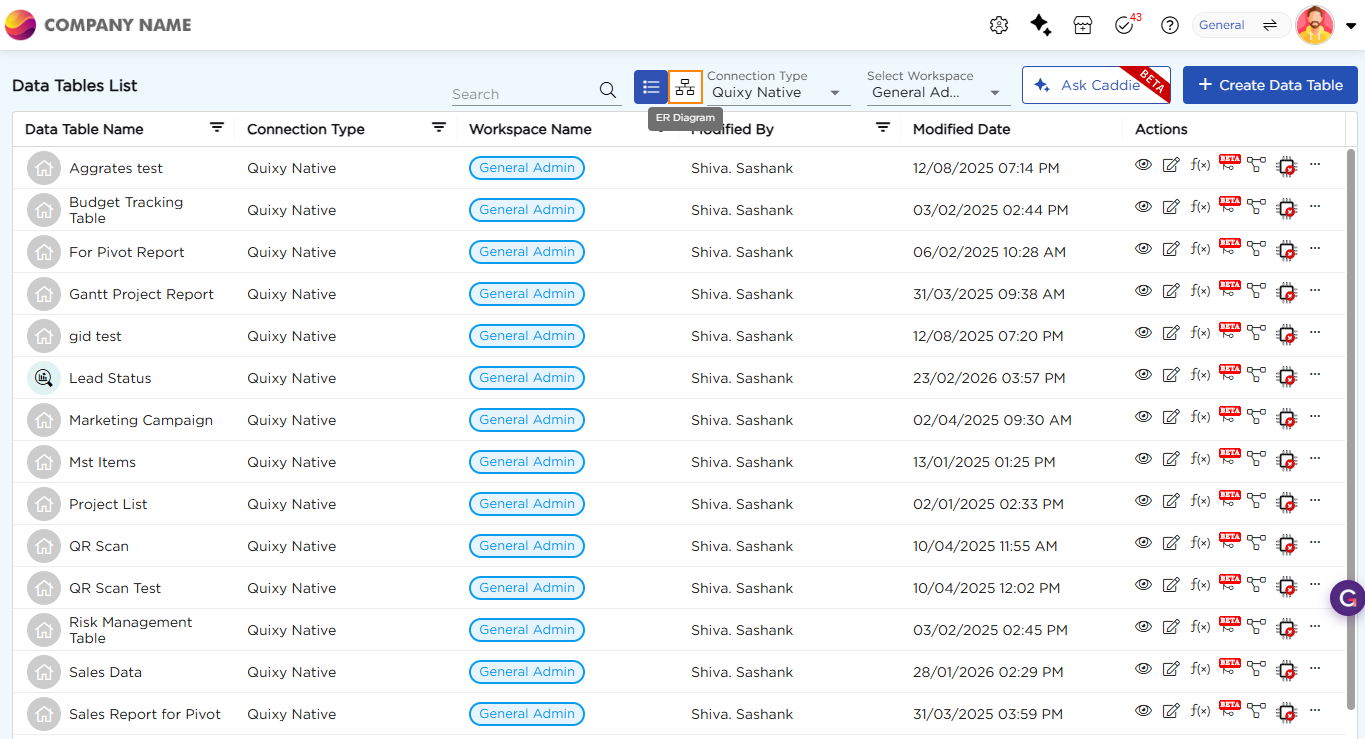
2. From the Data Tables list page, view the list of available data tables.
3. Click the ER Diagram icon in the top toolbar to open the ER View.
When ER View opens, a comprehensive ER diagram of all data tables in the workspace is displayed, showing columns and relationships at a glance refer to the image below.