A Solution View offers users a simplified visual representation that shows how different artifacts of their process automation are connected. It provides an easy-to-understand overview of the design structure and flow, helping users see how everything fits together. These visuals are useful for understanding complex setups, identifying connections, and planning or improving processes within Quixy.
With the ability to visualize up to 20 levels of connections, the Solution View gives a comprehensive perspective on artifact relationships directly within the platform. Advanced filtering options help declutter the view by applying predefined filters such as Apps, Data Tables, Data Sources, Data Reports, and Views. You can also apply more specific filters like App Reports, Triggers, External Connections, Lookups, and Payment Gateways to narrow the focus further.
Flexible navigation features make it easier to explore the view. You can zoom in up to 200% for detailed examination or zoom out for a broader view of the structure. If the default view feels constrained, you can expand it to full screen to improve visibility and view more artifact relationships at once. You can also reset the view to its default state at any time to return to the starting point.
This enhanced functionality provides an efficient and flexible way to manage and visualize project artifacts.

Note
To view dependencies or connections among the artifacts in the Solution View, users must create at least one artifact.
Read the table below to know for which artifacts the Solution View is applicable:
| Artifact Category | Solution View Applicability | Artifact Category | Solution View Applicability |
|---|---|---|---|
| Apps | Yes | Workspace | NA |
| App Events | Yes | Toaster Configurations | NA |
| Data Tables | Yes | Lookups | NA |
| Data Source | Yes | Role | NA |
| Merged Data Source | Yes | User Manual | NA |
| Reports | Yes | Data Table Functions | Yes |
| Views | Yes | Data Table Sync | NA |
| DS Reference | Yes | DS Addons | NA |
| External Lookup | Yes | Report Scheduler | NA |
| App Reports | Yes | Organizational Themes | NA |
| External App Reference | Yes | Public Dashboard | NA |
| Payment Gateway | Yes | Custom Menu | NA |
| External Data table | Yes | Low Code Functions | NA |
| External DB Connection | Yes | - | - |
| Data source Schedule Notification | Yes | - | - |
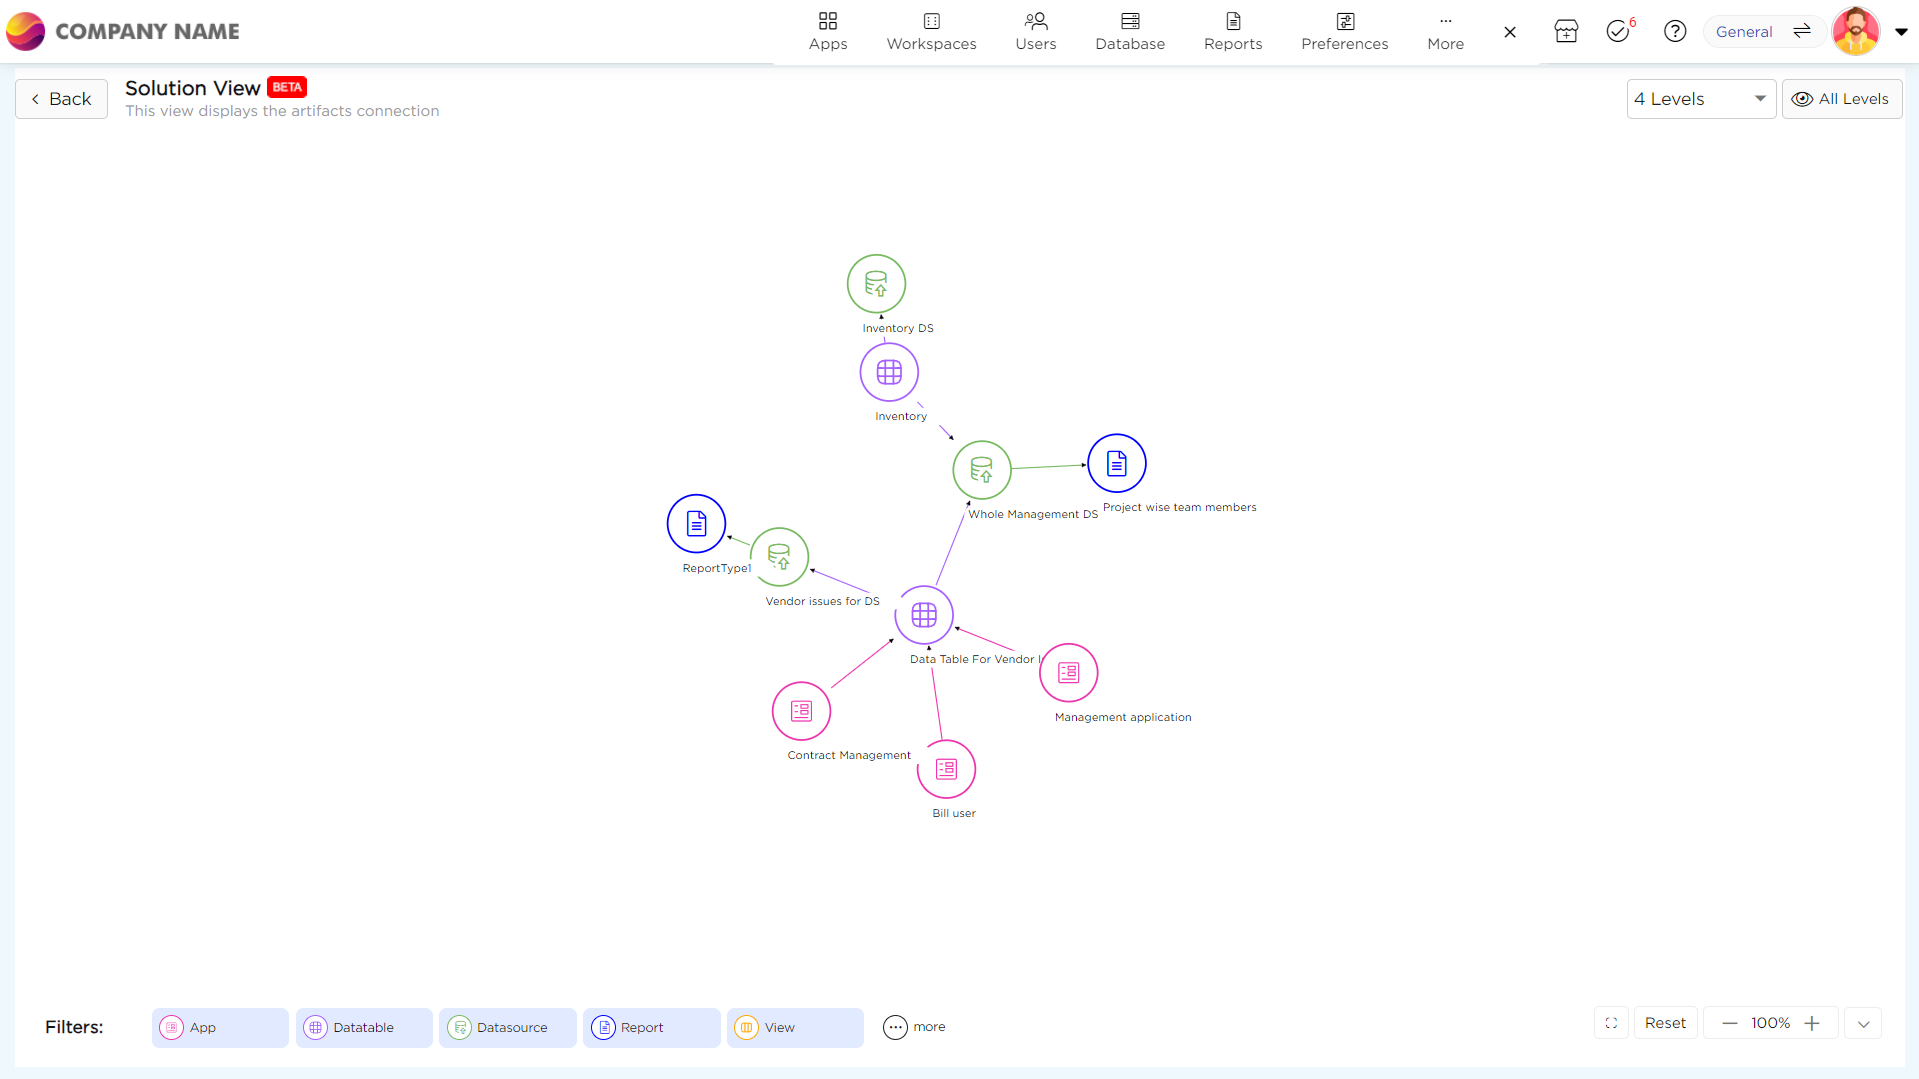
Let's see how a Solution View looks like:
¶ 1. Apps
- To access the Solution View for an app, follow these steps:
- Navigate to the Admin menu → Apps.
- Choose Manage apps from the menu.
- On the Manage Apps page, locate the app you're interested in and hover your mouse over it. A three-dot menu will appear.
- Click on the three-dot menu, and among the options provided, select Solution View.
- You will be directed to a page where all the artifacts linked to the selected app, interconnected with arrow marks to illustrate their relationships.
¶ 2. Data Tables
- To access the Solution View for a data table, follow these steps:
- Navigate to the Admin Menu → Database.
- Choose Data Tables from the menu.
- On the Data Tables page, locate the table you're interested in and hover over to the Solution View icon of the table and click on it.
- You will be directed to a page where all the artifacts linked to the selected table, interconnected with arrow marks to illustrate their relationships.
¶ 3. Filters in Solution View
Upon entering the Solution View, you'll see a visual map of relationships between artifacts. Below the map, you can find filters that allow you to include up to 14 different artifacts by selecting them. There are five primary artifacts listed that you could click on to add related artifacts to the map, showing their connections.
Additionally, a three-dot menu next to the filter provides access to over 10 more artifacts, allowing you to explore their relationships as well. The artifact from which you accessed the Solution View will be the central focus of the map, serving as the centerpiece for visualizing connections.
Artifacts which can be filtered are:
| Artifacts | |
| Application | App User function |
| Data table | Custom Script |
| Data source | Data Source Reference |
| Report | Data Source Scheduler Notification |
| Views | Data table functions |
| App Data function | External App References |
| App Integration | External Connections |
| App Quickflow | External Lookup |
| App Report | External Lookup |
| App Triggers | |
¶ 4. Levels in Solution View
In the Solution View, levels (place on the top right corner) refer to the depth of artifact relationships you can visualize within the map. This feature allows you to explore up to 20 levels of connections, providing a detailed and hierarchical view of how different artifacts are interrelated. Each level represents a layer of relationships, helping you to understand not just direct connections but also the broader network of interactions within your solution. By navigating through these levels, you can gain comprehensive insights into the complexity of your process automation and better manage the intricacies of your project.
Note
By default, when you open the Solution View, the view is set to display up to level 4.