A Document Report presents data in a structured format for a specific audience and purpose. In Quixy, Document Reports help you generate professional documents directly from application data, removing the need for manual document creation.
You can include text, tables, images, and application fields to create documents such as invoices, certificates, letters, and other shareable reports.
¶ 1. How to create a Document Report?
There are two ways to start creating a Document Report:
¶ 1.1. From Dashboard
- Go to Admin Menu → Reports → Create Report.
- The platform prompts you to select a data source and then takes you to the report creation page. Select the report type as Document, provide a name, and proceed.
¶ 1.2. From Data Source Page
- Select the data source → Actions → Create Report.
- The platform navigates you to the report creation page. Select the report type as Document, provide a name, and proceed.
- After selecting Document as the report type, follow these steps to configure the report:
- Enter a name for the report.
- Select the Add-On if you want to attach external static columns and rules.
- Click Next.
You will be taken to the Document Report configuration page.
On this page, the right side contains an empty canvas used to build the report, and the left side lists the elements required to design the report.
¶ 1.1. Report Editor Layout
The Document Report editor consists of two main sections.
- The left panel displays elements and functions used to build the report
- The central canvas is used to design the report layout
At the top of the editor, the following options are available.
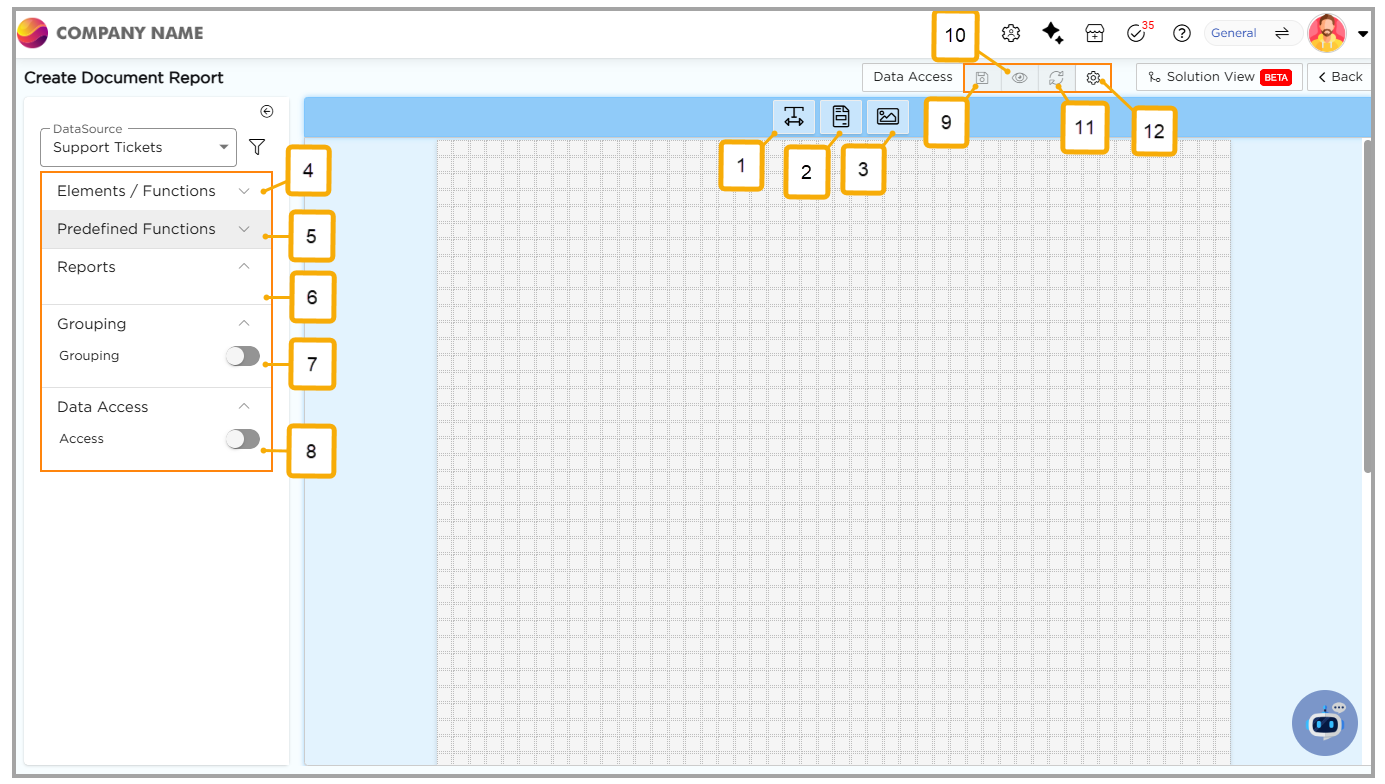
¶ 1.1.1. Editor Options
| # | Option | Description |
| 1 | Text Label | Text label is used when you want to enter certain text with elements that are available from the data base. You can even edit the text, increase the size, and insert tables and more. |
| 2 | Rich Text Editor | This Works same like a text label but with more text customization options like inserting HTML snippets for design, can insert images, print options just like a word document. |
| 3 | Image | This option allows you to insert logos, images of the company or product by attaching a simple URL link. |
¶ 1.2. Data and Layout Options
| # | Option | Description |
| 4 | Elements/Functions | Elements or Functions here represent the data fields that are present in the data tables captured by a particular app. For each type of element (like Text Field, Number Field, Date Field, etc.) there will be respective functions like set it as Default Value, Upper Case, Lower Case, Pascal Case, QR Code, Bar Code for Text fields and Selection of Year, Month, Weekday. |
| 5 | Predefined Functions | Predefined functions are used to insert fields like date, date time. When any of these functions are used in the report that report will be printed along with the date, date time or page number as per the given predefined function. |
| 6 | Reports | This Reports option is used to insert any type of report into the document report. |
| 7 | Grouping | Grouping option allows you to put data together by selecting an element from the list of the fields available in the data base. |
| 8 | Data Access | After selecting all the required elements and functions, data access is given by selecting a user from the drop-down to give the required access. This enables only that user to see/access the report that has been configured. |
¶ 1.3. Editor Actions
| # | Option | Description |
| 9 | Save | Once all are set and fixed by clicking on save that report is being saved and can be used wherever needed. |
| 10 | Preview | When the document report is created (in creation process) before saving it completely if we want to get a glimpse of the report and make any changes use the preview option. |
| 11 | Reset | If you want to reset the report back to its previous stage reset option is helps you. |
| 12 | Page Settings | In this page setting, you will be able to set the page Size, layout, no of pages you want for a document. Not only just the page size or layout you can even set the water mark and borders for the report designed as stated below. |
¶ 2. Page Settings
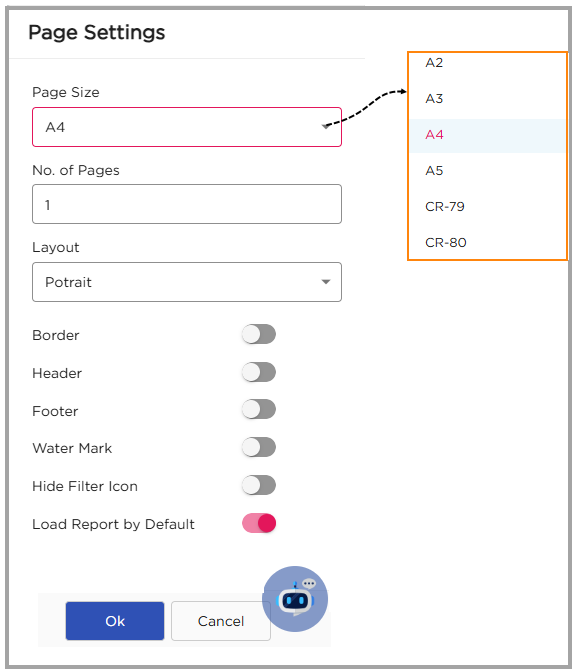
Page Settings allow you to control the formatting and layout of the document. You can configure:
- Page Size: User can select predefined page sizes like A2, A3, A4, A5, CR-79, CR-80
- Number of Pages
- Layout: User can select the page layout out of two options “Portrait / Landscape”.
- Border: User can select the option to enable border for document report.
- Header: On enabling Header option, user can be able to customize the document report header.
- Footer: On enabling Footer option, user can be able to customize the document report footer.
- Watermark: User can enable this option to make an image as watermark.
- Hide Filter Icon:
- Load Report by Default:
¶ 3. Report Permissions
| Permission | Description |
|---|---|
| PDF Export | Allows users to export the report in PDF format. |
| Column Chooser | Allows users to select columns from the column chooser. |
| Column Filter | Allows users to filter data by column. |
| Enable Grouping | Allows users to enable grouping in the report. |
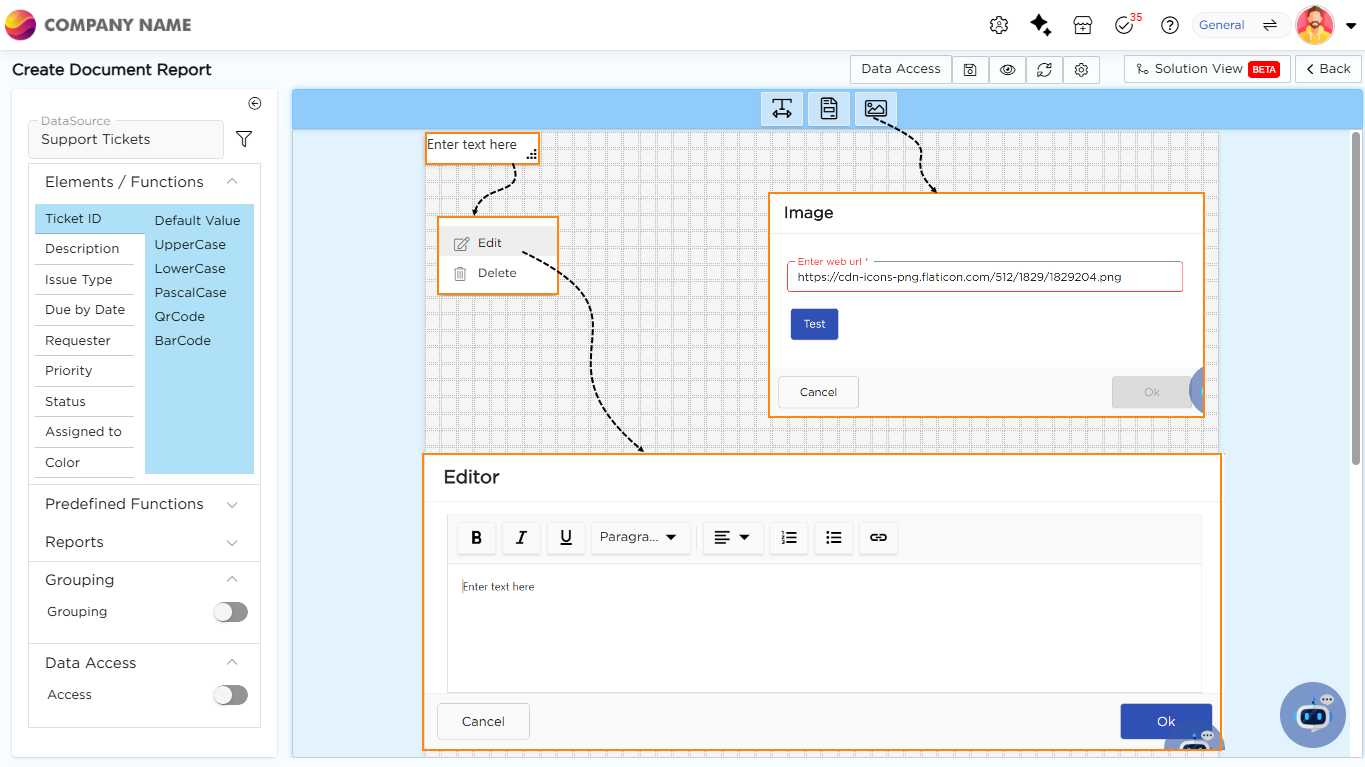
¶ 4. Steps to Design a Document Report
- User can design the document report by embedding beautiful labels, rich text editors to capture the data, and images (E.g.: company logos)
- To embed the labels in the report, click on the label option, and a label would display on the builder arena.
- User can edit the label to enter any text (i.e., Heading, Element, etc.), right click on the label to see the edit option.
- Click on the edit option to open the label editor.
- To place any element on the editor, select the element, select the respective function and then click anywhere on the editor arena.
- Follow the same process to embed the rich text editor in the editor.
- To embed an image, user need an image URL.
- Click on the image option.
- An image pop-up would display on the screen asking the user to enter the image URL of the image that the user wants to embed.
¶ 5. Document Report's end-user experience
The document report will have the following options as explained below on the top right corner of its page.
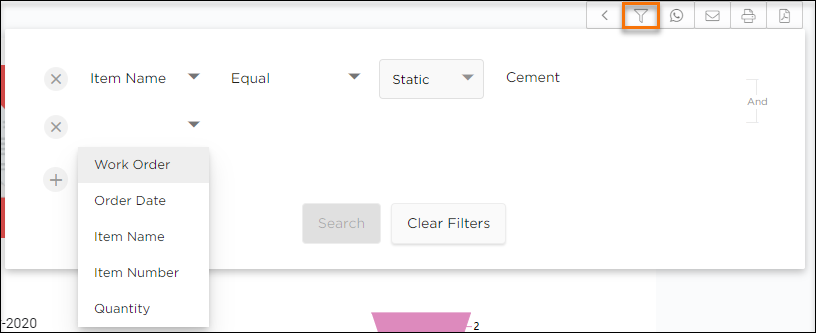
- Filters: Use this option to filter out data based on the report parameters.
- WhatsApp: Use this option to send a document report to any WhatsApp number. This will improve reliability and make things easier in sending the document report.
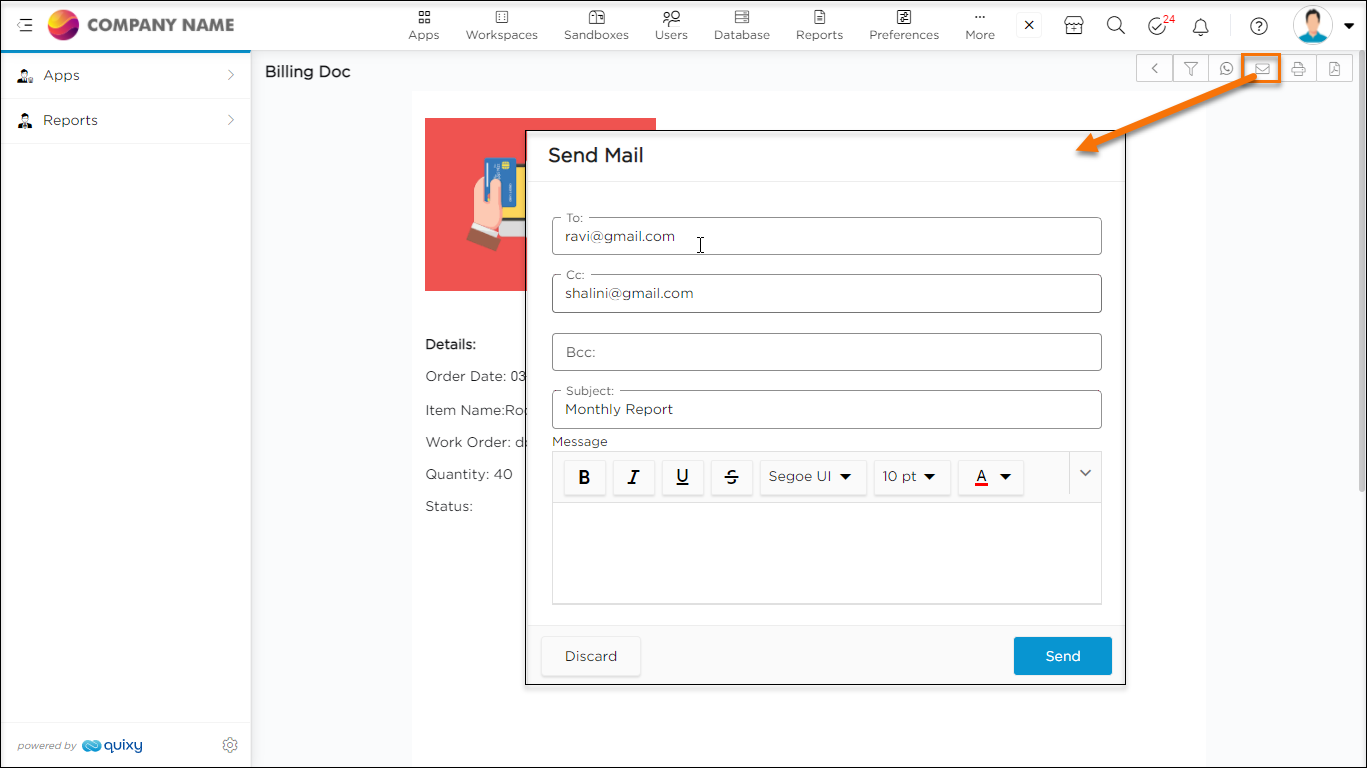
- Email: Use this option to email a document report to any user.
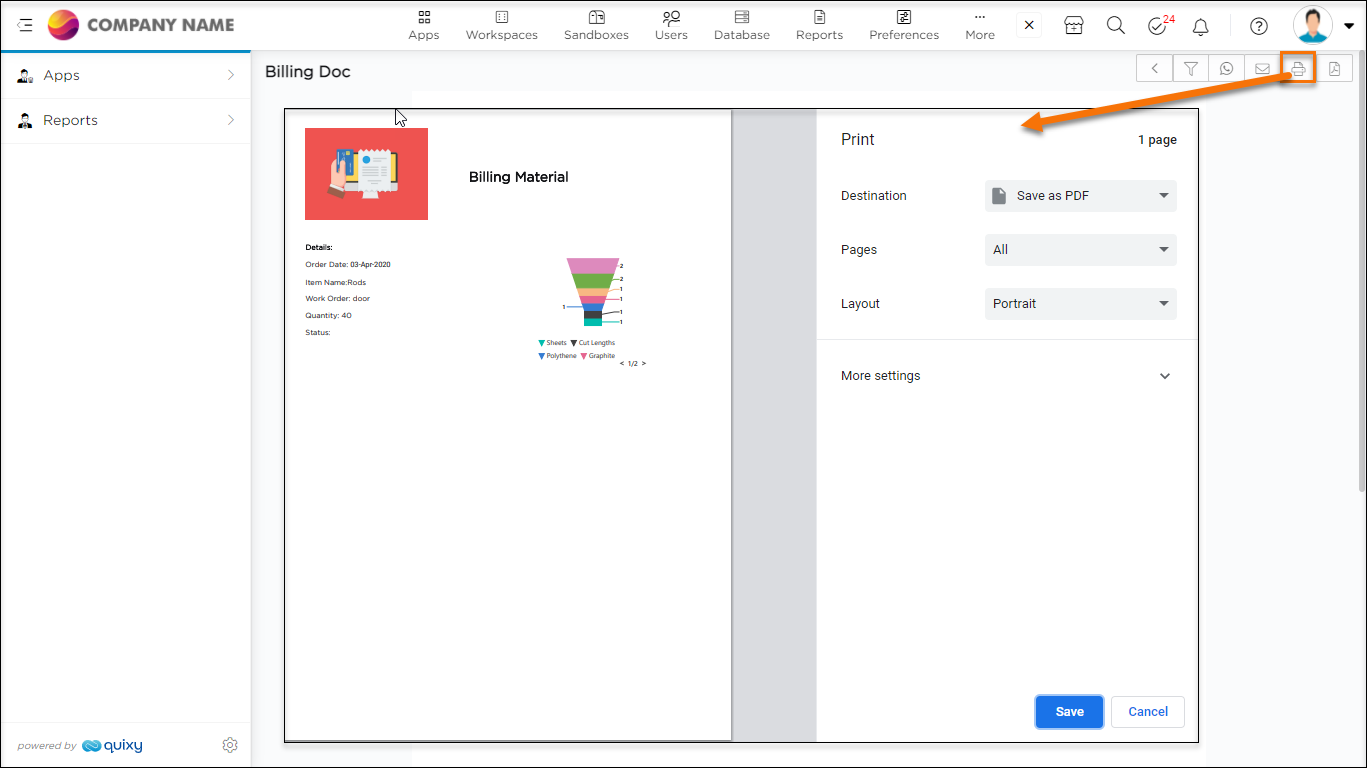
- Print: Use this option to quick print the document report. Set the required standards and print the document report.
- Export PDF: Use this option to download a document report in PDF format.