A Grid Report presents data in a tabular view, where each column represents a field and each row represents a record. It resembles a spreadsheet. Grid reports are commonly used to view and analyze large amounts of data, as they allow users to sort, filter, group, and aggregate data in various ways to gain insights and make informed decisions.
Example
Let's say you run a manufacturing company that produces and sells multiple products. You want to track the sales performance of each product and identify which products are generating the most revenue. Using a grid report, you can create a table that displays the following information for each product:
- Product name
- Total units sold
- Total revenue generated
- Cost of goods sold (COGS)
- Gross profit margin (%)
With a grid report, you can easily compare the sales performance of different products, identify any trends or patterns, and make data-driven decisions about which products to prioritize or discontinue. You can also use filters and sorting options to analyze the data in different ways, such as by sales region, sales rep, or time period. This allows you to gain valuable insights into your business and make informed decisions to drive growth and profitability.
¶ How to create a Grid report?
- Creating a grid report is simple, yet it is loaded with considerable options to play with the data, such as Aggregated, Data Access, Serial Numbers, and so on, to obtain the desired output of data visibility to fit the business needs.
- On the Report-type selection (Create Report) page, select the Grid, fill-in the particulars and click Next.
- On the grid report configuration page, you can see the data fields of the data source that is being used to create the grid report.
- Along with the data, the options offered in the grid report are shown below.
Note
The name of the grid report is prominently displayed at the top of the sheet, addressing the previous issue of names being invisible in a gray area. The names are now presented in bold and a larger font, ensuring clear identification when exporting to Excel, PDF, or sharing via Email or WhatsApp.
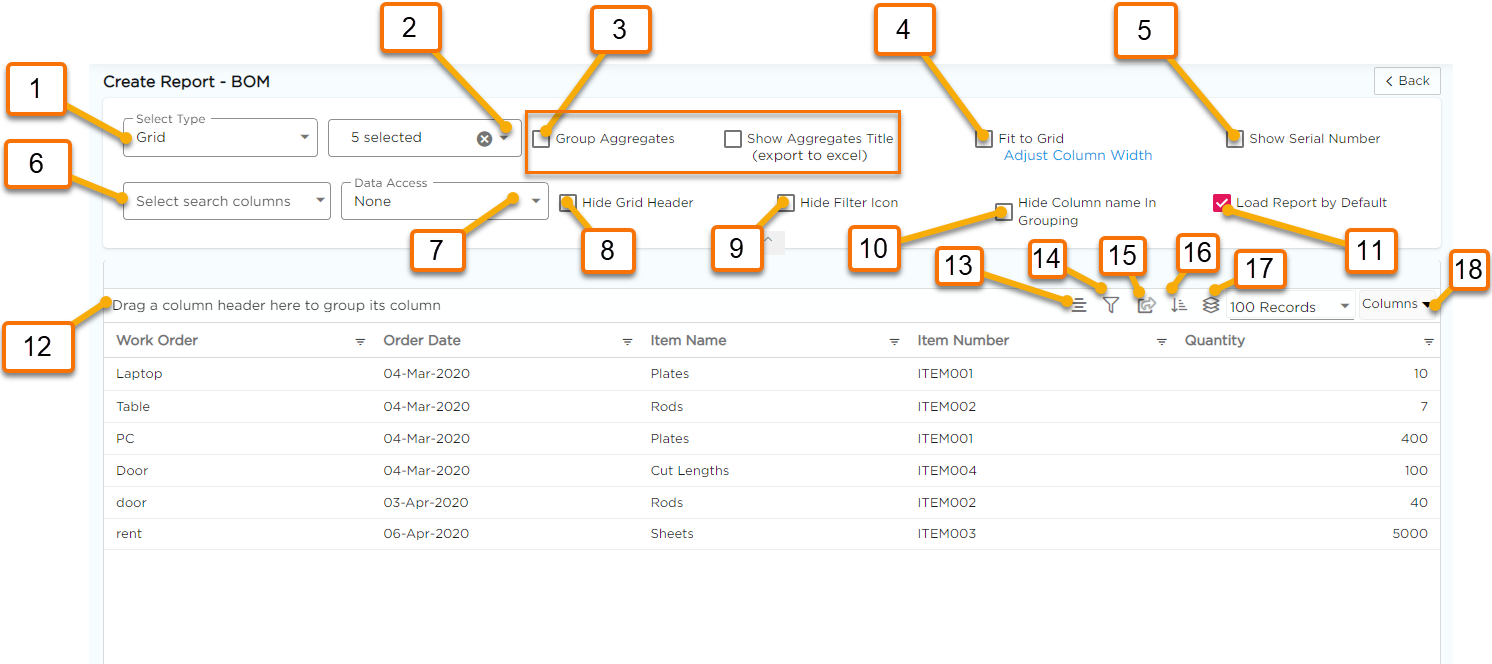
| Serial Number | Grid Options | Description |
| 1 | Report Types drop-down | Displays the list of report types available in Quixy. |
| 2 | Grid Actions drop-down (Dedicated for End-users) |
Displays a list of actions as given below which admin can provide to the end-users to do more with the grid report.  PDF Export: To export the grid report as a PDF.  Enable Grouping: Allows the end-users to structure and get a hierarchical view of data. For example, in a Purchase Order report, columns might be grouped by Item Number or region, allowing users to quickly compare and analyze purchase data.  |
| 3 | Group Aggregates & Title |
Allows you to get the desired calculations on the data by enabling this option. For numerical data, obtain calculations such as Count, Sum, Min, Max, and Average. Obtain the record count for rest.  |
| 4 | Fit to grid | Enable this option to automatically adjust the column widths of all data columns in a grid report to be even, regardless of how many columns are available or selected. |
| 5 | Show serial number |
Enable this option to get consecutive serial numbers to all of the records in the grid report.  |
| 6 | Select search columns |
to optimize the global search to obtain faster search results. Select the desired columns available in the grid report so that the platform will only search through them when looking for requested data.  |
| 7 | Data access | This option lets admins give a specific user access to their own data and restrict access to the data that other users have added to the grid report. Employee Email, Employee Code, and Company Name are My Profile- User Detail fields. |
| 8 | Hide Grid Header | Admins can utilize this option to hide the column headers within a grid report. This feature can be particularly valuable when displaying the grid report in various locations, such as a document report or an application, where grid records are more meaningful without the headers. See the document report below for an example. |
| 9 | Hide Filter Icon | Admins can utilize this option to hide the filter icon within a grid report which limits the user's ability to filter the data displayed in the report. |
| 10 | Hide Column Name in Grouping | Admins can utilize this option to hide the column name that is used for grouping and structuring the data. |
| 11 | Load Report by Default | the Load Report by Default option works in conjunction with the Quick Filters feature and allows you to have more control over how data is displayed in your grid reports. Enabling this option will automatically show quick filtered data to end-users when they open the report, while disabling it will hide the data and require end-users to adjust the quick filters to their desired values and click on the search button to display the intended data. With this option, you can ensure that end-users only see the most relevant data. |
| 12 | Grouping Arena | This is the space where the users drag-and-drop the column headers to group the data. |
| 13 | Alignment | This option will allow you to take control over the alignment of the list view headers or data, which can be Left, Right, or Center for each column. |
| 14 | Filter | Admins can use this option to add filters to a grid report. These filters will be set up in advance for end-users, but the admins can choose to make them editable. This means that users can modify or remove the pre-defined filters, or add new ones on top of them. Admins can also enable Quick Filters, which makes it easier for users to access the pre-defined filters on the report. |
| 15 | Export (Dedicated for Admins) | This option has the list of options as given below to export the data available in the grid report in various forms for admins use. Copy to Clipboard: Allows the end-user to take a copy of the data along with its column headers and paste it either in Excel, Note pad, Word, etc. Excel Export: Admins have the option to download the complete Report into a single sheet or into separate sheets in an Excel workbook. For exporting to multiple sheets, simply select a data column for grouping, and the platform will automatically group related records with matching values into separate sheets. To export to a single sheet, click on the "export to single sheet" option, and all the data will be exported to a single sheet. Your browser does not support the audio element.PDF Export: To export the grid report as a PDF. Export Settings: This option allows you to configure the Page Size, Orientation, and Scaling options for grid reports. These settings determine how the report will look when it's exported by you or the end-users and can help ensure that the report is easy to read and understand. Your browser does not support the audio element. |
| 16 | Sort | This option allows you to sort data in the respective columns in an alphabetical order either in A-Z or Z-A. Your browser does not support the audio element. |
| 17 | Stack Headers | This option allows you to stack your report headers up to three levels, providing a more organized and user-friendly display of your data. Group the related headers together and present data in a hierarchical format. This makes it easier to understand and analyze complex data sets, and provides a more intuitive way to navigate your reports. |
| 18 | Columns drop-down | This drop-down menu displays all the data columns that are available in the data source that you have used to create the grid report. You can select the columns that you want to include in the report and remove the ones that are not necessary. |
- Simply click the Save option to finish the grid report creation, and the report will be available for ready reference. However, the grid data can be altered in a variety of ways to meet business requirements, as detailed later in the article.
Note
You can instantly download files with fewer than 5,000 records by clicking the Excel export button. But to download a large (any) number of records from list views in Excel or PDF format. Upon clicking on excel report the export runs in the background so you can keep working. You'll get a notification once the export is ready, and you can download it from the global notification section, along with any previous exports. No need to re-export.
Note
You can also create a consolidated view of aggregates at the Column level by grouping the data by your column's choice and enabling the Show Aggregates option on the Grid reports. Choose suitable aggregate options for your data columns to view insightful information.