.png)
Fish Bone Analysis
- 2 Minutes to read
- Contributors

Fish Bone Analysis
- 2 Minutes to read
- Contributors
Article Summary
Share feedback
Thanks for sharing your feedback!
Fishbone Analysis for Root Cause Problem-Solving in Quixy
Fishbone analysis (also known as a cause-and-effect or Ishikawa diagram) is a thoughtful problem solving technique used to identify the root causes of a problem or issue within your Quixy workflows or processes. Quixy’s data management and visualization capabilities allow you microscope a problem's root causes.
Understanding Fishbone Analysis
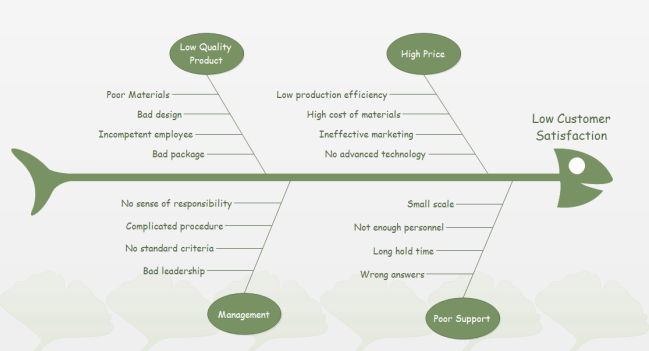
Visual Representation: Imagine a fish skeleton. The "head" of the fish represents your problem statement, and major cause categories branch off the central spine as "bones." Specific causes and sub-causes extend as smaller bones, creating a visual hierarchy.
The main categories typically include:
- Method: Processes, procedures, or methods used.
- Machine: Equipment, tools, or machinery involved.
- Material: Raw materials, resources, or inputs used.
- Measurement: Metrics, data, or measurements taken.
- Environment: Surrounding conditions, settings, or external factors.
- People: Human factors, skills, knowledge, or personnel involved.
Purpose: Helps teams brainstorm, categorize, and uncover hidden relationships between factors contributing to the problem, facilitating the identification of root causes.
Configuration
To create a fish bone analysis report; First, you will need three tables as given below: Learn to create tables...
- Table 1: Problem Statement
- Problem ID (Primary Key)
- Problem Description
- Created Date
- Table 2: Cause Categories
- Category ID (Primary Key)
- Category Name (e.g., Methods, People, Machines)
- Table 3: Causes Table
- Cause ID (Primary Key)
- Cause Description
- Problem ID (foreign key referencing Problem Statement)
- Category ID (foreign key referencing Cause Categories)
To create a fish bone analysis report; second, you will need a Data source: Learn to create Data source...
Join Tables: Use data source to establish relationships among the tables based on their respective ID fields. This sets the foundation for your reporting.
Creating Fishbone Reports in Quixy
To create a fish bone analysis report; Third, you will need to configure the Fishbone Analysis Report.
- Visual Design:
- Layout: Use containers and positioning to mimic the fishbone structure (head, spine, branching bones).
- Text Fields: Populate text fields dynamically using data retrieved from your data source.
- Lines or Shapes: Optionally, utilize basic shapes to enhance the visual structure.
- Data Retrieval:
- Select Problem: Allow the user to select the relevant Problem ID.
- Query Data Source: Construct a query to fetch the associated problem statement, cause categories, and their corresponding causes from your joined data source.
- Populate the Visualization: Dynamically fill your designed layout with the retrieved data.
EXAMPLE
Problem (Head of Fish): Late Delivery of Orders
Method (Bone):
- Shipping process: Inefficient route planning, delays in loading/unloading.
- Order processing procedure: Inaccurate order processing, delays in verification.
Machine (Bone):
- Delivery vehicles: Vehicle breakdowns, maintenance issues.
- Packaging equipment: Equipment malfunction, inadequate packaging materials.
Material (Bone):
- Inventory availability: Stock outs, delays in replenishment.
- Quality of packaging materials: Fragile packaging, inadequate protection.
Measurement (Bone):
- Accuracy of delivery time estimates: Over commitment, lack of real-time tracking.
- Monitoring of delivery schedules: Lack of oversight, delays in reporting.
Environment (Bone):
- Traffic conditions: Congestion, road closures.
- Weather disruptions: Rain, snow, storms affecting delivery routes.
People (Bone):
- Delivery personnel skills/training: Inadequate training, lack of familiarity with routes.
- Communication between departments: Lack of coordination between sales, operations, and logistics.
Analysis:
By visualizing the potential causes using Fishbone Analysis, we can systematically explore each category to identify root causes contributing to the late delivery of orders. This analysis can help us prioritize areas for improvement and develop targeted solutions to address the underlying issues.
Was this article helpful?