.png)
Customize Dashboards
- 8 Minutes to read
- Contributors


Customize Dashboards
- 8 Minutes to read
- Contributors
Article summary
Did you find this summary helpful?
Thank you for your feedback!
Dashboard is a centralized display of data that presents an overview of essential information and key performance indicators (KPIs) in a visually appealing and easily accessible format. It serves as a hub for tasks, applications, and user activity, enhancing the convenience of day-to-day work.
Users can customize a dashboard to display data from various sources, such as databases, apps, etc. Multiple visualizations, including charts and tables, can be included to help users identify trends, patterns, and anomalies in the data quickly.
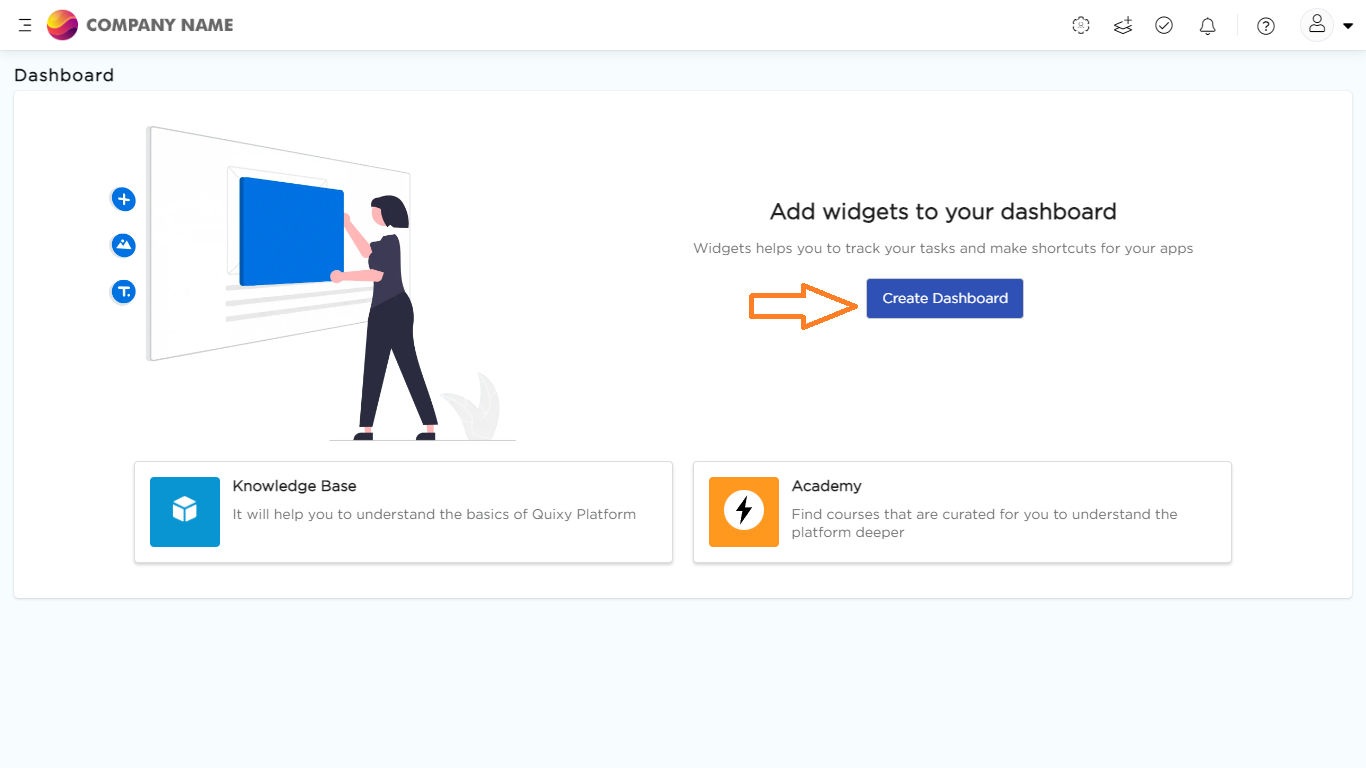
Any user be it admin or end-user when they land fresh on to the platform they will be given a default dashboard as shown below.
.png)
This default dashboard is designed to provide users with an initial understanding of what the platform can offer, as well as to encourage them to customize the dashboard according to their needs. In addition, it provides learning resources, such as an Academy or Knowledge Base, to help users get started with using the platform.
How to Customize/Create a Dashboard?
- Click on the Create Dashboard option to start configuring the dashboard.
- The platform will ask you to name the dashboard before moving to the configuration canvas. Provide a name and save it.
.png)
- The platform will navigate you to the dashboard configuration canvas. Start adding dashlets such as Reports/Shortcuts/List screens by clicking Add Dashlet.
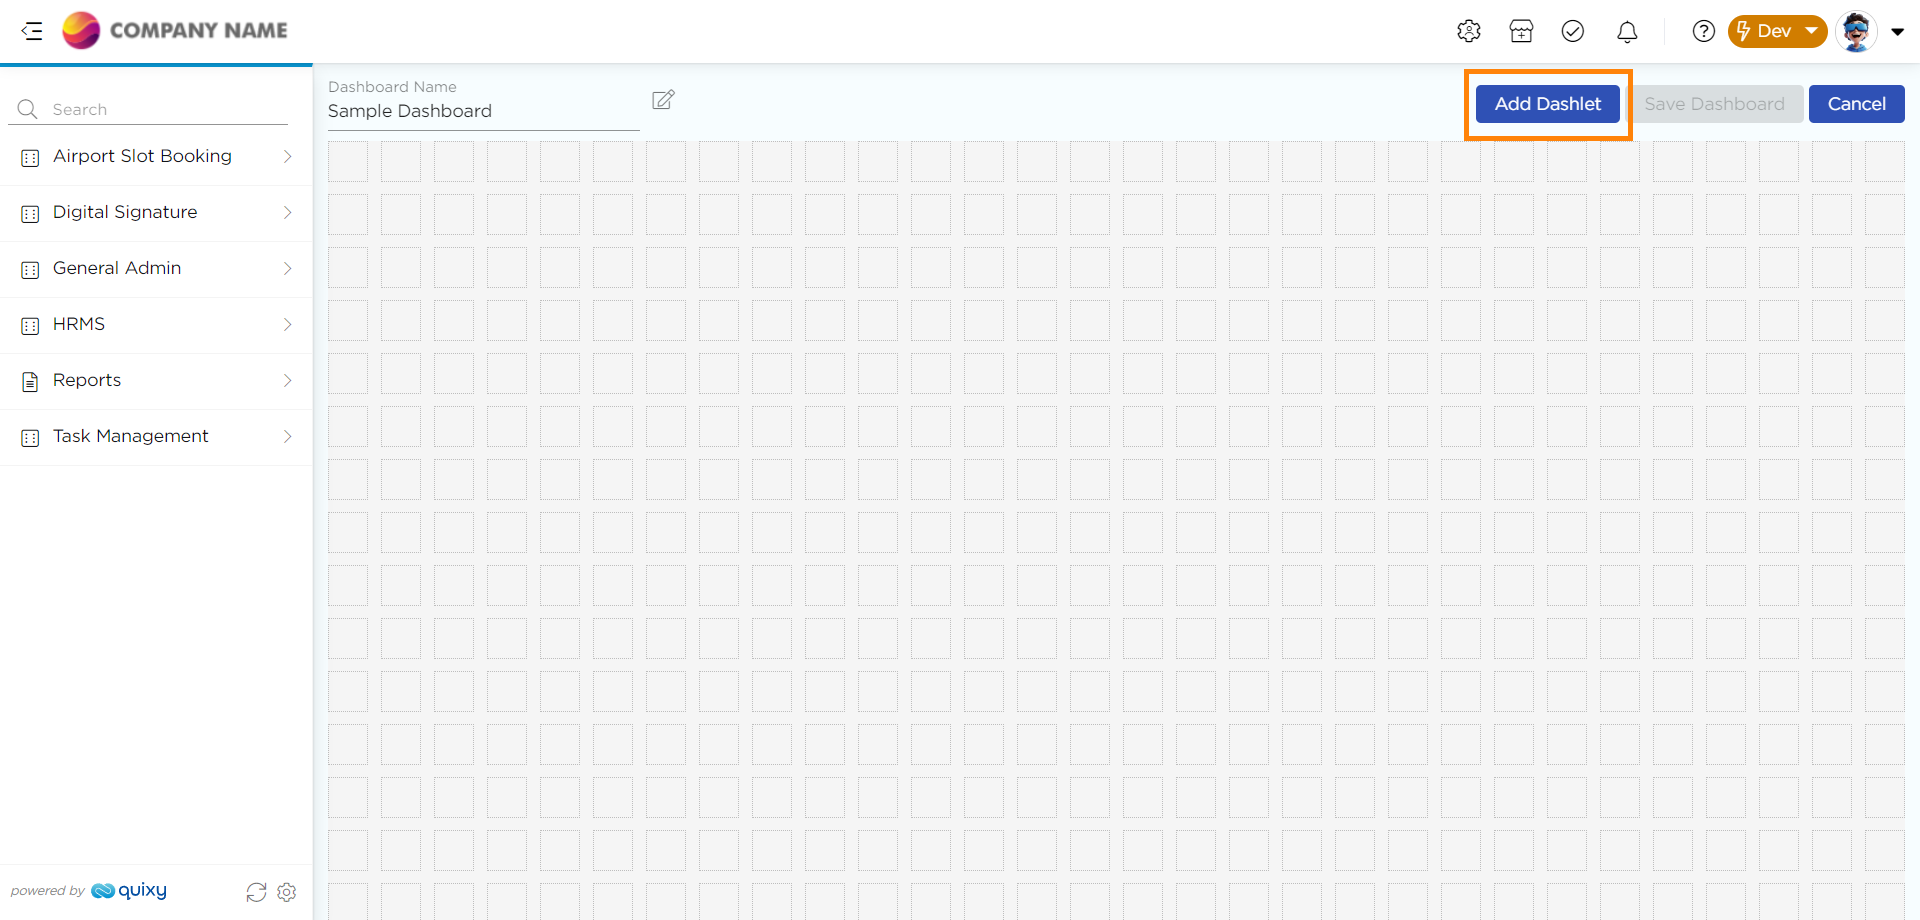
- A Dashlet Settings pop-up displays on the screen with several drop-down columns which will provide you with the options (i.e., Shortcuts, Reports, List screen, etc.) that you want to place on the dashboard.

.png)


- Click on the Dashlet Category drop-down, and select an option from the drop-down list. The list has the following options.
- Shortcuts
- Number
- Reports
- Tasks
- List Screen
- Blank Space
- Rich Text
- Admin View
- Activity Stream
NOTE
Dashlet can also be set as a pop-up. This is applicable only for Reports Data Count and List view.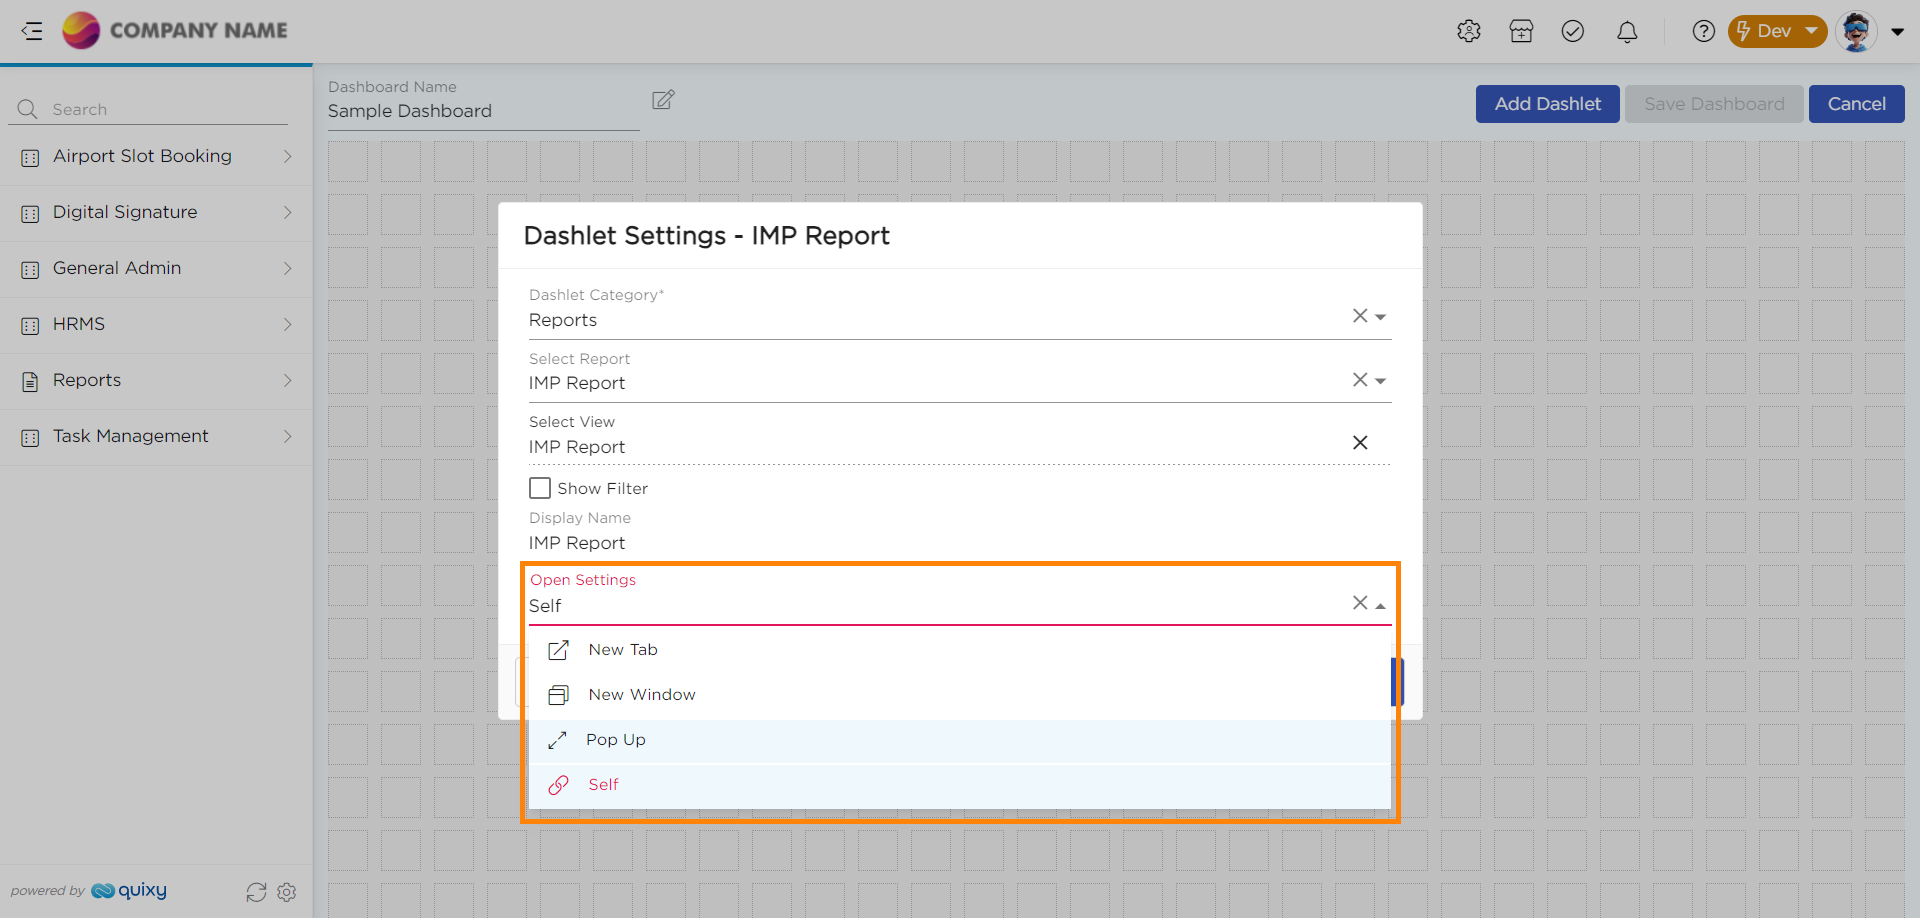

Now, let's understand each Dashlet Categories separately
Shortcuts
This one creates a shortcut on the Dashboard. Upon selecting Shortcuts, a Sub Type drop-down appears and allow you to choose an element for which you want to create a shortcut of the element.
- App-Add Record: You can access the Add record feature of an app from the dashboard to perform a transaction in the app.
- App-Initiated: You can access the App Data of an app from the dashboard by accessing the shortcut.
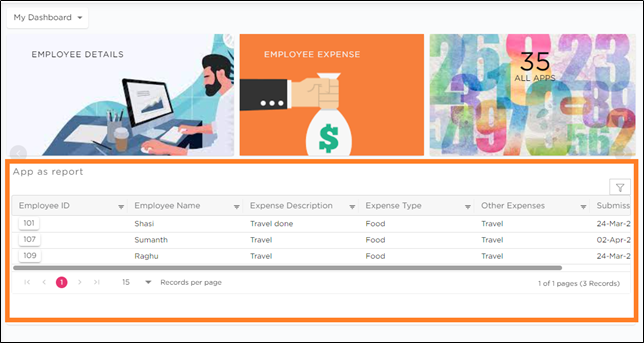
- App- App as Report: If you wish to open an app as a report from the dashboard itself (like we do in the List screen), this option will make your life a lot easier.
- Open Report: You can access a Report from the dashboard by accessing the shortcut.
- Open List Screen: You can access a list screen just by accessing the shortcut.
- Dashboard: To quickly open a specific dashboard from a list with just a single click, you can assign it in this section. While it may initially appear as a pop-up, clicking on it will directly redirect you to the assigned dashboard, serving as a convenient shortcut.
1-3. App-Add Record, App as Report, Initiated:
- Select the Dashlet Category as Shortcuts.
- Select the Shortcut Type as App-Add Record or App as Report or Initiated.
- Choose the Workspace from the Workspace drop-down menu to add the application from the workspace to the dashboard.
- Select an app from the available applications.
- Enter a Display Name. (The same name would be shown on the dashboard)
- Click on the Open Settings drop-down, and select an option from the list i.e., New Tab, Self, New Window.
4-5. Open- Report, List Screen:
- New Tab: This setting allows the user to open the shortcuts in a new tab in a web browser.
- New Window: This setting allows the user to open the shortcut in a new Window.
- Self: This setting allows the user to open the shortcut on the current screen.
- Pop-up: This setting allows the user to open the List Screen, Tasks, and Reports as a Popup Window.
NOTE
Open Settings is same for all the dashlet categories in the Dashboard.

NOTE
Numerous additional setting options are accessible in the Dashlet Settings pop-up window after selecting the Open Settings option. These settings can be utilized to improve the visual appeal of the dashlets on the dashboard, though they are not obligatory.
- Click on the Save button to save the Dashlet.
- You will see the shortcut to Add Record for the selected App placed on the Dashboard, as shown below.
Now that you have added a dashlet (App Shortcut) on the canvas, you have additional provision to resize the dashlet or change its place, refer to GIF below.
VVIP NOTE
To add shortcuts to the dashboard as dashlets, simply follow the steps outlined above for each of the shortcut sub-types and for all the other categories as well.
Number option
This option allows the users to show the count of records on the dashboard.
Below are the sub-types of Count.
- Tasks: This option lets you see the total number of pending tasks on the dashboard.
- Report Data Count: This displays the count of records present in the selected report.
- Calculated value on Report aggregated Field(s): This option allows you to make autonomous calculations such as Sum, Min, Max, and Average on the numerical fields available in the selected report and present it on the dashboard.
- Calculated value on List View aggregated Field(s): This option allows you to make autonomous calculations such as Sum, Min, Max, and Average on the numerical fields available in the selected report and present it on the dashboard
- App-Initiated: This option is to show the count of records that you have added in an application.
- Apps-All: This option is to show the count of all the apps that you have created in the platform.
- Apps-Workspace: This option is to show the count of all the apps that you have created in the workspace.
- Data Table Record Count: This option is to show the count of all the records that are present in a selected datatable.
- List Screen: This option allows the users to determine the number of records available in a list screen directly from the dashboard.
Reports option
This option helps you to attach/place a report on the dashboard.
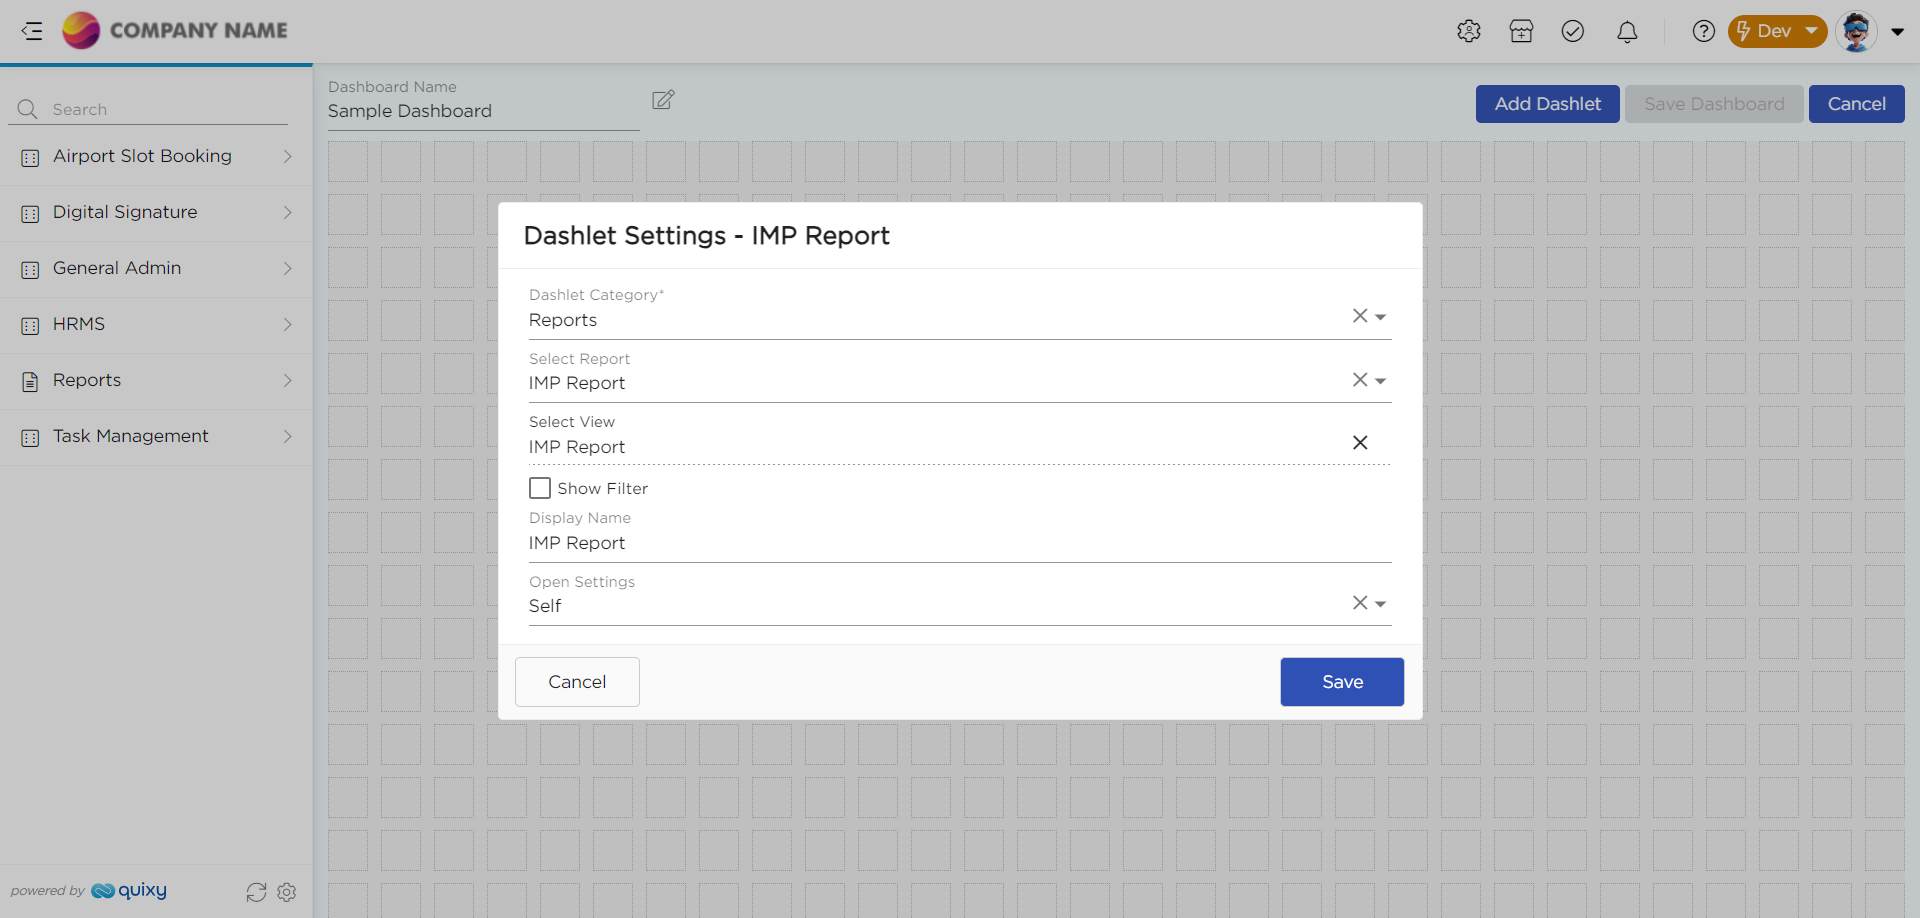
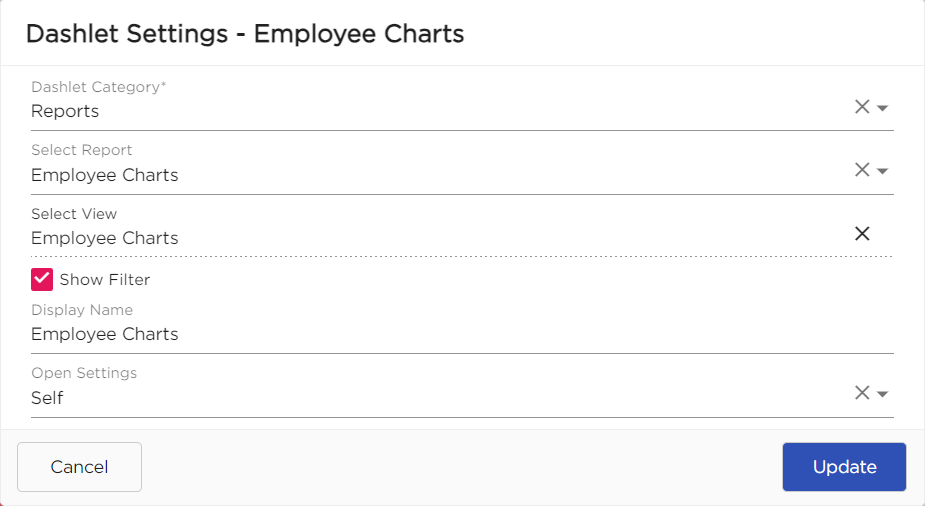
- Select Reports from the Dashlet Category.
- Select the Report that you need to place on the Dashboard.
- Check the Show Filter option, if you want the provision to apply filters to the report on the dashboard.
- Select Open Settings.
- Click on the Save.
- You will see the Report on the Dashboard.

NOTE
When you select the dashlet category as report, platform will show you all types of reports that you have access to.
FOCUS!!!
1. When ever you add a report to the dashboard, and opt for filters, you shall have an option, as shown below to filter out the data in the report and show only the desired output.
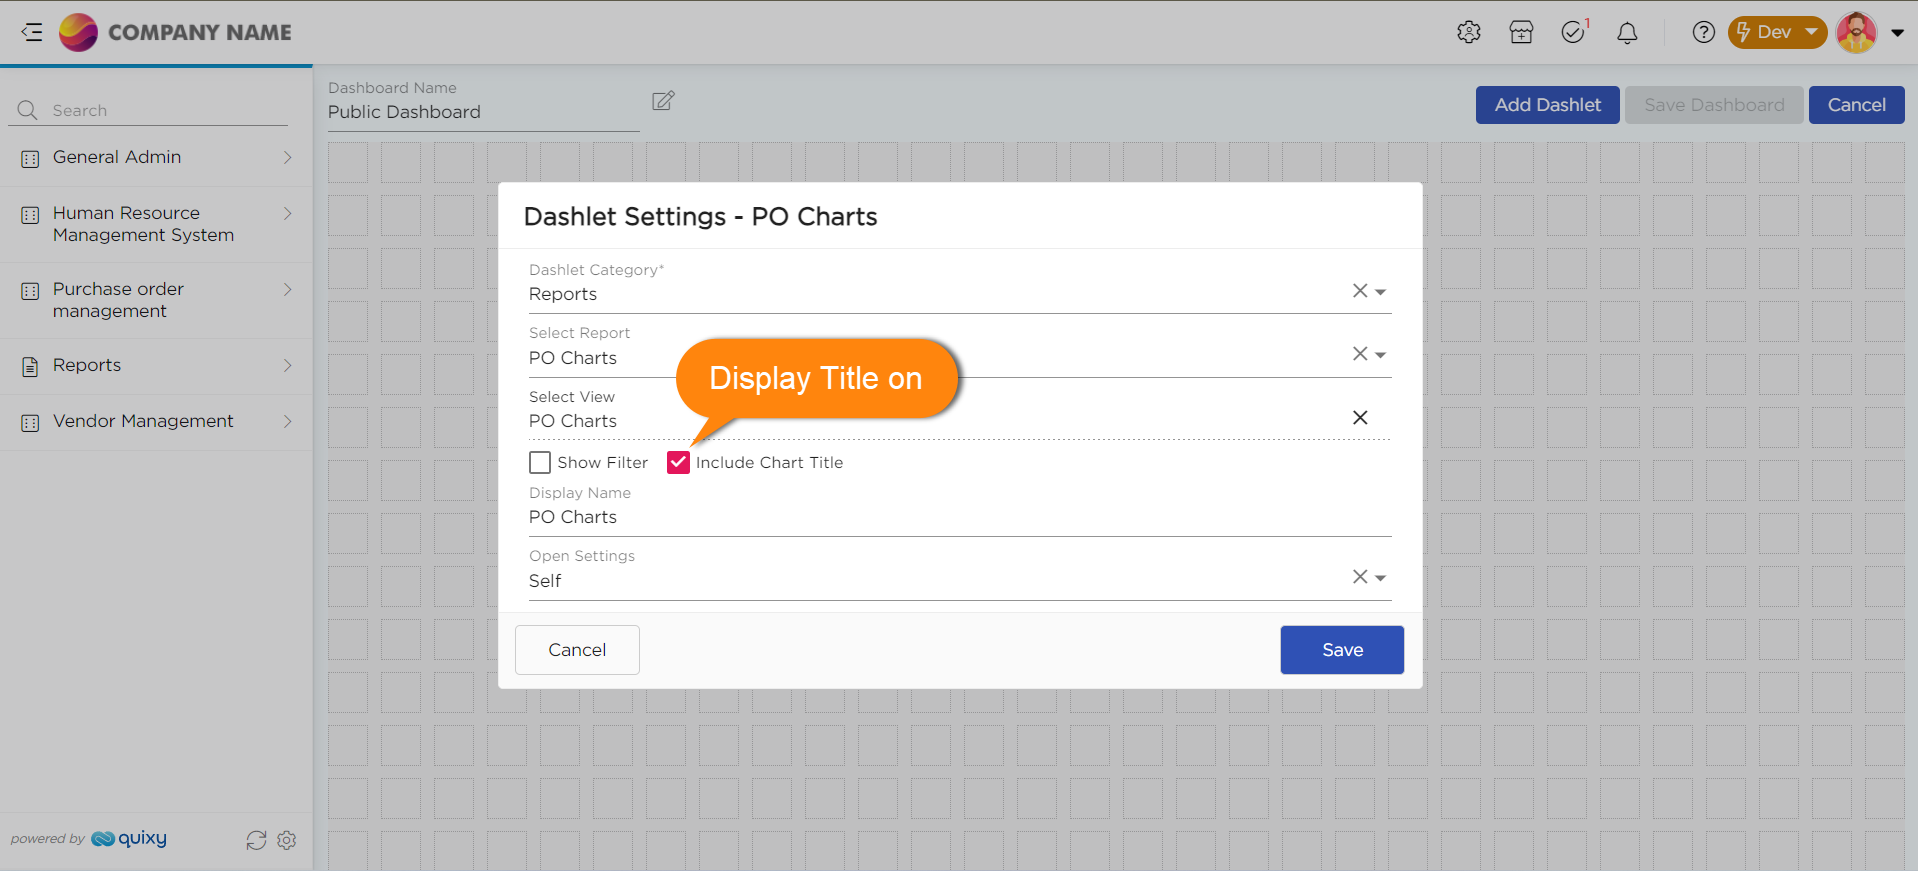
2. When adding a Charts Report to the dashboard, you can now choose to include or exclude the chart title by enabling "Include Chart Title" in the dashlet settings.

2. When adding a Charts Report to the dashboard, you can now choose to include or exclude the chart title by enabling "Include Chart Title" in the dashlet settings.

- Click on the Filters and apply the filter to the report for the desired output view.

Tasks option
This option allows you to add your tasks directly to the dashboard, eliminating the need to navigate to the tasks screen each time you want to check your own or your team's progress on a work.
The different types of tasks that you can place on the dashboard are listed below.
- My Tasks: This option will show you the list of your personal tasks that you receive on daily basis.
- My Team Tasks: This option will show you the list of all the tasks owned by your team, if you are leading a team in your organization
- Manage Tasks: This option will also show you the list of all the tasks owned by your team, if you are leading a team in your organization, but this option gives you provision to only manage the tasks by assigning them to other members of your team but not perform any action on the tasks.
- Grouped: This option will also show you the list of all the tasks that are grouped (i.e., saved views of filtered or sorted or grouped tasks).

You may get a sense of how the tasks will appear on the screen by looking at the image below.

List Screen option
This category option allows you to attach/place a List Screen on the Dashboard.
- Select the Dashlet Category as List Screen.
- Select the List Screen that you want to place on the dashboard.
- Enter the Display Name of the selected List Screen.
- Select the Open Settings.
- Click on Save.

You may get a sense of how the tasks will appear on the screen by looking at the image below.
Blank Space option
This option will create a blank space on the dashboard.
- Select the type as Blank Space from the Dashlet Category.
- Click on Save.

Rich Text
Use the new RTE dashlet to show meaningful and beautiful images and use HTML in the RTE on the dashboard to make custom branding titles.

Admin View option
This option is to set the dashboard back to default view.
- Select the type as Admin View from the Dashlet Category.

- Click on Save.
- You will see all the features at a glance.

Activity Stream option
This option shows all the activities that you have performed on the platform on the dashboard.
- Select the Dashlet Category type as Activity Stream.
- Click on Save.

You may get a sense of how the tasks will appear on the screen by looking at the image below.

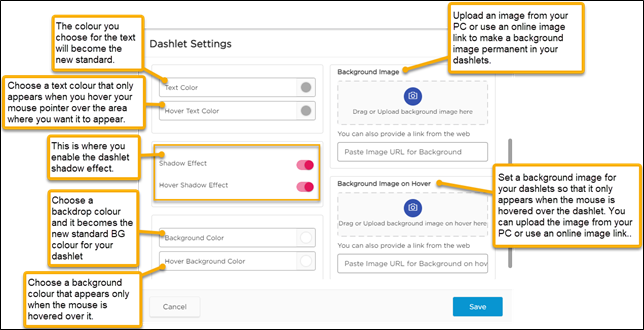
Personalize your Dashboard with Custom Wallpapers
Personalize your dashboard by adding custom wallpaper to make it truly your own. Upload an image of your choice and watch as your Dashlets float on top of it. Not only does it make your dashboard look great, but it also adds a touch of your unique style/branding and personality to your work environment.

NOTE
Users can have a seamless experience as filters applied to both pivot and individual reports on a dashboard will persist even in maximized views. This improvement eliminates the hassle of repeatedly reapplying filters, ensuring a smoother and more efficient data analysis process.
Manage Dashboards
Our platform’s Manage Dashboards page has been enhanced with three significant improvements. These updates aim to enhance clarity, ease of use, and organization, making dashboard management more efficient.
Shared Dashboards
"Public dashboards" have been renamed to "Shared dashboards" for better clarity. Previously, sharing public dashboards required selecting roles or individual users immediately upon making them public. Now, dashboards can be made sharable first, with the option to decide whom to share them with later, ensuring comprehensive access.

Default Dashboards
The process of setting a default dashboard has been enhanced with the introduction of a star icon. This star icon, located on the extreme left of the dashboard list, makes it easier to identify the default dashboard. Clicking the star sets that dashboard as the default, automatically replacing the previous one.

Identification Tags
Tags have been added to dashboard names for better identification. These tags indicate whether a dashboard was created by you, shared by you, or shared with you. Additionally, hovering over the "Shared by others" tag reveals the name of the person who shared the dashboard.

Was this article helpful?