.png)
Area Chart
- 1 Minute to read
- Contributors

Area Chart
- 1 Minute to read
- Contributors
Article summary
Did you find this summary helpful?
Thank you for your feedback!
An Area Chart is a graphical representation of quantitative data. It descends a few line chart characteristics and highlights the area with colors and textures to emphasize the area between the axis and the line.
There are various types of Area Charts in Quixy which you will learn about as you read this article.
NOTE
To understand the Advanced Settings, Report Mapping, and other functionalities, it is recommended that you first read the Chart Reports parent article. To maintain the continuity of this feature, a few references from the parent article will be used in this article.
How to create area charts?
- On the data source list page, select the data source for which you want to create a chart report, and click on
 to create a report.

- You will land on the report configuration page, as shown below.

- The Select Type drop-down will provide the list of report types like grid, pivot, individual, charts, and multiple charts available in Quixy.

- Select the report type as Chart, and select the chart type as Line.

NOTE
The Area Chart itself has 7 sub-types, such as Area, Spline Area, Step Area, Range Area, Stacking Area, 100% Stacking Area and Area Zone. The configuration is same for all the charts. However, the visual characteristics will differ for each sub-types.
- Select the sub-type as Area Chart from the Type drop-down as required. Provide the rest of the details like X-Axis, Y-Axis, Operation, and Operation Field, refer to GIF below. (Refer to Chart Reports article to understand the use/purpose of the X-Axis, Y-Axis, Operation, and Operation Field)

- Select the data fields in Group by column to see a visual representation of a consolidated data segmentation/data drill-down for the selected data field in the same selected sequential order.
- Save and View the Area Chart Report, as shown in the GIF below. Refer to the GIF below.

AREA CHART TYPES
For your convenience, sample mockups for various sub-types of Area chart reports are provided below.
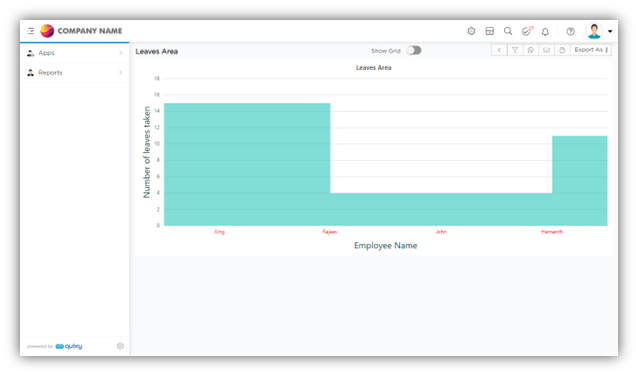
Sub-Type: Step Area
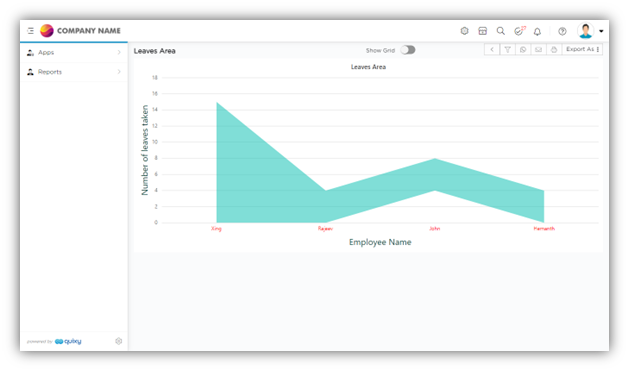
Sub-Type: Stacking Area
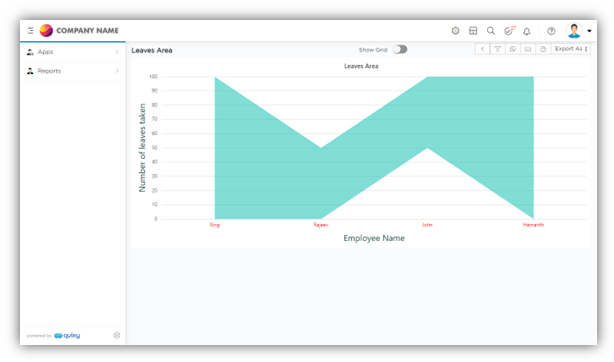
Sub-Type: 100% Stacked Area
Sub-Type: Step Area

Sub-Type: Stacking Area

Sub-Type: 100% Stacked Area

Was this article helpful?